10-K: Annual report pursuant to Section 13 and 15(d)
Published on March 21, 2022
UNITED STATES
SECURITIES AND EXCHANGE COMMISSION
Washington, D.C. 20549
FORM
(Mark One)
|
ANNUAL REPORT PURSUANT TO SECTION 13 OR 15(d) OF THE SECURITIES EXCHANGE ACT OF 1934 |
For the fiscal year ended
OR
|
TRANSITION REPORT PURSUANT TO SECTION 13 OR 15(d) OF THE SECURITIES EXCHANGE ACT OF 1934 FOR THE TRANSITION PERIOD FROM TO |
Commission File Number
(Exact name of Registrant as specified in its Charter)
|
(State or other jurisdiction of incorporation or organization) |
(I.R.S. Employer Identification No.) |
|
|
|
|
|
(Address of principal executive offices) |
(Zip Code) |
Registrant’s telephone number, including area code: (
Securities registered pursuant to Section 12(b) of the Act:
|
Title of each class
|
Trading Symbol(s)
|
Name of each exchange on which registered
|
The |
Securities registered pursuant to Section 12(g) of the Act: None
Indicate by check mark if the Registrant is a well-known seasoned issuer, as defined in Rule 405 of the Securities Act. Yes ☐
Indicate by check mark if the Registrant is not required to file reports pursuant to Section 13 or 15(d) of the Act. Yes ☐
Indicate by check mark whether the Registrant: (1) has filed all reports required to be filed by Section 13 or 15(d) of the Securities Exchange Act of 1934 during the preceding 12 months (or for such shorter period that the Registrant was required to file such reports), and (2) has been subject to such filing requirements for the past 90 days.
Indicate by check mark whether the Registrant has submitted electronically every Interactive Data File required to be submitted pursuant to Rule 405 of Regulation S-T (§232.405 of this chapter) during the preceding 12 months (or for such shorter period that the Registrant was required to submit such files).
Indicate by check mark whether the Registrant is a large accelerated filer, an accelerated filer, a non-accelerated filer, smaller reporting company, or an emerging growth company. See the definitions of “large accelerated filer,” “accelerated filer,” “smaller reporting company,” and “emerging growth company” in Rule 12b-2 of the Exchange Act.
Large accelerated filer |
☐ |
Accelerated filer |
☐ |
|
|
|
|
☒ |
Smaller reporting company |
||
|
|
|
|
Emerging growth company |
|
|
If an emerging growth company, indicate by check mark if the Registrant has elected not to use the extended transition period for complying with any new or revised financial accounting standards provided pursuant to Section 13(a) of the Exchange Act. ☐
Indicate by check mark whether the Registrant has filed a report on and attestation to its management’s assessment of the effectiveness of its internal control over financial reporting under Section 404(b) of the Sarbanes-Oxley Act (15 U.S.C. 7262(b)) by the registered public accounting firm that prepared or issued its audit report.
Indicate by check mark whether the Registrant is a shell company (as defined in Rule 12b-2 of the Exchange Act). Yes
As of June 30, 2021 (the last business day of the Registrant’s most recently completed second fiscal quarter), the aggregate market value of the Registrant’s common stock held by non-affiliates of the Registrant was approximately $
The number of shares of Registrant’s common stock ($0.0001 par value) outstanding as of March 18, 2022, was
DOCUMENTS INCORPORATED BY REFERENCE
AIRGAIN, INC.
TABLE OF CONTENTS
FORM 10-K
For the Year Ended December 31, 2021
|
|
Page
|
|
|
|
Item 1. |
4 |
|
Item 1A. |
19 |
|
Item 1B. |
43 |
|
Item 2. |
43 |
|
Item 3. |
43 |
|
Item 4. |
43 |
|
|
|
|
|
|
|
Item 5. |
44 |
|
Item 6. |
44 |
|
Item 7. |
Management’s Discussion and Analysis of Financial Condition and Results of Operations |
45 |
Item 7A. |
56 |
|
Item 8. |
56 |
|
Item 9. |
Changes in and Disagreements With Accountants on Accounting and Financial Disclosure |
56 |
Item 9A. |
56 |
|
Item 9B. |
57 |
|
Item 9C |
Disclosure Regarding Foreign Jurisdictions that Prevent Inspections |
57 |
|
|
|
|
|
|
Item 10. |
58 |
|
Item 11. |
58 |
|
Item 12. |
Security Ownership of Certain Beneficial Owners and Management and Related Stockholder Matters |
58 |
Item 13. |
Certain Relationships and Related Transactions, and Director Independence |
58 |
Item 14. |
58 |
|
|
|
|
|
|
|
Item 15. |
59 |
|
Item 16. |
59 |
2
PART I
FORWARD-LOOKING STATEMENTS AND MARKET DATA
This annual report on Form 10-K contains forward-looking statements within the meaning of Section 21E of the Securities Exchange Act of 1934, as amended, or the Exchange Act. All statements other than statements of historical fact contained in this annual report, including statements regarding our future operating results, financial position and cash flows, the impact of COVID-19, our business strategy and plans and our objectives for future operations, are forward-looking statements. These statements involve known and unknown risks, uncertainties and other important factors that may cause our actual results, performance or achievements to be materially different from any future results, performance or achievements expressed or implied by the forward-looking statements. This annual report on Form 10-K also contains estimates and other statistical data made by independent parties and by us relating to market size and growth and other data about our industry. This data involves a number of assumptions and limitations, and you are cautioned not to give undue weight to such estimates. In addition, projections, assumptions and estimates of our future performance and the future performance of the markets in which we operate are necessarily subject to a high degree of uncertainty and risk. In some cases, you can identify forward-looking statements by terms such as “may,” “will,” “would,” “could,” “should,” “expect,” “plan,” “anticipate,” “intend,” “target,” “project,” “contemplate,” “believe,” “estimate,” “predict,” “potential” or “continue” or the negative of these terms or other similar expressions. The forward-looking statements in this annual report are only predictions. We have based these forward-looking statements largely on our current expectations and projections about future events and financial trends that we believe may affect our financial condition, operating results, business strategy, short-term and long-term business operations and objectives. These forward-looking statements speak only as of the date of this annual report and are subject to a number of risks, uncertainties and assumptions, including those described in Part I, Item 1A, “Risk Factors.” The events and circumstances reflected in our forward-looking statements may not be achieved or occur and actual results could differ materially from those projected in the forward-looking statements. Moreover, we operate in a very competitive and rapidly changing environment. New risk factors and uncertainties may emerge from time to time, and it is not possible for management to predict all risk factors and uncertainties. Except as required by applicable law, we do not plan to publicly update or revise any forward-looking statements contained herein, whether as a result of any new information, future events, changed circumstances or otherwise.
Airgain, the Airgain logo, and other trademarks or service marks of Airgain appearing in this annual report are the property of Airgain, Inc. This annual report also includes trademarks, tradenames and service marks that are the property of other organizations. Solely for convenience, trademarks and tradenames referred to in this annual report appear without the ® and symbols, but those references are not intended to indicate, in any way, that we will not assert, to the fullest extent under applicable law, our rights, or that the applicable owner will not assert its rights, to these trademarks and tradenames.
3
ITEM 1. BUSINESS
Overview
Airgain is a leading provider of advanced wireless connectivity solutions and technologies used to enable high performance networking across a broad range of devices and markets, including consumer, enterprise, and automotive. Our mission is to connect the world through optimized integrated wireless solutions. Combining design-led thinking with testing and development, our technologies are deployed in carrier, fleet, enterprise, residential, private, government, and public safety wireless networks and systems, including set-top boxes, access points, routers, modems, gateways, media adapters, portables, digital televisions, sensors, fleet tracking, in-vehicle networking, and asset tracking devices. Through our pedigree in the design, integration, and testing of high-performance wireless modules and antenna technology, we have become a leading provider of integrated communications products that solve critical connectivity needs.
We built the foundation of our business through the evolution of the IEEE 802.11 protocol standards. Over the years, we have diversified our wireless connectivity solutions into cellular communications, starting with 3G technology, leading to LTE and more recently, 5G. As the number of wireless standards has increased, we have adapted to develop the necessary solutions to meet end customer needs.
Airgain’s core business primarily focuses on the following three key targeted markets:
4
As a wireless connectivity solution provider that has a history in radio frequency technology, we are leveraging our experience in embedded antenna solutions and embedded modems to transition from a components provider to a wireless system solutions provider. In 2020 we announced our new patented AirgainConnect® platform. We believe this flagship platform offers a novel solution in our public safety and fleet focused automotive markets and will play a key role in our future strategy for 5G solutions internationally for automotive and enterprise markets. The first product from the AirgainConnect platform is the FirstNet Ready AirgainConnect AC-HPUE antenna-modem, targeting vehicles used by first responders like police, fire and EMS and public safety support vehicles which include bus, rail, courier, utility, waste or water management, and security. The AirgainConnect AC-HPUE antenna-modem includes an integrated high-power LTE modem supporting the 3GPP Band 14 HPUE (or high power user equipment) output power functionality known as MegaRange by AT&T. This compact vehicle antenna-modem solution tightly couples essential LTE radio components with the antenna system to provide improved connectivity for public safety and fleet vehicles certified to run on the AT&T FirstNet network. The AirgainConnect AC-HPUE more than doubles the range of existing solutions, a result of its ability to transmit 10 times the power of existing solutions today. The incremental power improves the ability to communicate in challenging environments including dense urban areas, underground garages and tunnels, and provides a significant advantage for first responders in poor signal coverage areas like rural areas or mountain ranges. Through technological innovation, the AirgainConnect AC-HPUE antenna-modem combines the modem and antenna elements designed to deal with complexities of integration and heat dissipation, while maintaining a sleek form factor that is suitable for placement on a vehicle, which is a reason why AirgainConnect AC-HPUE is the first antenna-modem product servicing AT&T FirstNet.
The AirgainConnect AC-HPUE antenna-modem initially targets the U.S. first responder market, which we believe represents a $500 million plus addressable market for products in the AirgainConnect platform. The average selling price of the AC-HPUE is near the $1,000 range, which represents a significant increase over the average selling price for our portfolio of antenna products, which were sold in the tens of cents to tens of dollars range.
We have already begun developing products to address other U.S. carriers, global carriers, and enterprise fleet opportunities leveraging the AirgainConnect platform that will expand the $500 million plus addressable market significantly with a global total addressable market for the AirgainConnect platform we estimate at $4 billion today. We are very excited about this first product, the potential of the AirgainConnect platform overall, and the related growth potential as we further our transition to a wireless systems solutions provider.
We use third parties to manufacture our embedded antenna solutions while maintaining oversight for critical quality, test, and calibration functions. As of December 31, 2021, we had over 270 issued and pending patents worldwide.
NimbeLink Acquisition
On January 7, 2021 we purchased 100% of the outstanding shares of Minnesota-based NimbeLink Corp. NimbeLink is an IIoT company focused on the design, development, and delivery of cellular solutions for enterprise customers. NimbeLink provides carrier-certified embedded modems and asset tracking solutions that minimize or often eliminate RF design and certification time from project schedules, significantly reducing costs and time to market.
5
NimbeLink’s smart simple cellular solutions allow its customers to get their machines and asset connected to the internet quickly providing a quick time to market, driving data to the enterprise and allowing them to make better business decisions. Nimbelink’s go to market strategy is business to business with a core set of internal sales resources focused on leveraging a set of distributors and VARs. NimbeLink focuses on medium to large OEMs.
The acquisition of NimbeLink supports Airgain’s transition toward becoming a system-level company and will play an important role in our overall growth strategy to broaden market diversification, especially within the IIoT space. NimbeLink’s expertise in IIoT puts them squarely in one of our targeted submarkets, within the bigger enterprise market, and extends the breadth and opportunity for our AirgainConnect platform. For NimbeLink, Airgain’s worldwide salesforce represents a present opportunity to expand NimbeLink’s reach and NimbeLink will now gain access to design opportunities they were not previously able to win. The result is an increase in the opportunities for Airgain in the enterprise market and a more diverse offering of products and expertise for our customers. We plan to include products with the NimbeLink brand under our broader Enterprise IIoT product lines.
Industry Background and Market Opportunity
Global adoption of Wi-Fi has been a major contributor to our growth history to date. An increasing amount of people rely on Wi-Fi as the primary means to connect to the internet. Wi-Fi has become critical and vital to every public venue (retail shopping centers, airports, sports venues, the hospitality space, among others), and has become the key method for in-home consumer connectivity. As we transition to a more comprehensive wireless systems solution provider and continue to drive increased growth in the enterprise and automotive markets, mobile network (cellular) connectivity, and 5G in particular, is becoming an increasingly significant portion of our business, underpinned by the growth in cellular connectivity and data consumption demands globally. While historically Wi-Fi adoption was the primary contributor to our market potential, as we transition into a wireless systems solution provider we will consider mobile network connected device trends as an equal, if not more important indicator of our company’s market opportunity. We believe the greater proportion of traffic being transmitted and received over wireless technologies, and the transition to new and more capable wireless technology standards, are direct indicators of future opportunity for our antenna and wireless connectivity solutions and services.
During the COVID-19 pandemic Wi-Fi connectivity has grown in importance as consumers use it for connecting to videoconferencing, telehealth, and other critical applications and services. Wi-Fi has long been leveraged as one of the main solutions to meet the increasing demand for bandwidth, which enables operators to scale capacity to meet their subscribers’ needs. With advances and ratifications in Wi-Fi standards, dense environments with many concurrently connecting devices and IoT connections such as airports, public transportation, retail, healthcare, smart cities, stadiums, among others, result in public WI-FI use cases across multiple industry segments. Wi-Fi 4 and 5 Wi-Fi (IEEE 802.11ac) standards are expected to represent 66.8% of all WLAN endpoints by 2023 providing a range of speeds that allow users to view medium-resolution video streaming because of the higher throughput. Wi-Fi 5, with very high theoretical speeds, is considered a true wired complement or equivalent and can enable higher definition video streaming and services with use cases that require higher data rates. The latest Wi-Fi 6 (802.11ax) standard further improves the average throughput per user by a theoretical factor of at least four times in dense user environments, which will allow for dense IoT deployments. By 2023, 27% of all WLAN endpoints are expected to be equipped with Wi-Fi 6.
To help meet the increasing demand for Wi-Fi and other unlicensed services, the Federal Communications Commission, or FCC, has led the way making additional blocks of frequency spectrum such as 5.9GHz and 6-7GHz spectrum available. More spectrum and larger channel bandwidth provide the needed capacity to support even more devices, at even faster speeds. We believe this new available spectrum will represent an opportunity for our solutions in fixed wireless access deployments.
6
Mobile network devices are evolving from lower-generation network connectivity (3G) to higher-generation network connectivity (3.5G, 4G or LTE and now also 5G), combining device capabilities with faster, higher bandwidth and more intelligent networks will contribute to increased mobile and Wi-Fi traffic. According to the Cisco Annual Internet Report (2018-2023), over 70% of the global population will have mobile connectivity by 2023. The total number of global mobile subscribers will grow from 5.1 billion (66% of population) in 2018 to 5.7 billion (71% of population) by 2023. 5G devices and connections will be over 10% of global mobile devices and connections by 2023. By 2023 global mobile devices will grow from 8.8 billion in 2018 to 13.1 billion by 2023 – 1.4 billion of those will be 5G capable. The fastest growing mobile device category is M2M followed by smartphones. The mobile M2M category is projected to grow at a 30% CAGR from 2018 to 2023. Smartphones will grow at a 7% CAGR within the same period. This transition from 3G and below to 4G and now 5G deployment is a global trend and by 2023, nearly 60% of the mobile devices and connections globally will have 4G+ capability. North America will have the highest share of its devices and connections on 4G+ connectivity – 62% by 2023. By 2023 North America will be the region with highest share of connections on 5G at 17%.
Technology Benefits
We continuously strive to remain at the forefront of wireless technologies. We work closely with leading wireless chipset manufacturers, carriers and OEM’s on the cutting edge of new wireless technology introduction, while we continue to focus on extending our core competencies in product innovation, quality, levels of integration and OTA performance verification processes, helping to ensure we continue to deliver on our promise of optimal antenna and wireless system performance.
Benefits to our Customers
We have developed strong relationships with leading WLAN chipset vendors, OEMs, and key service providers, keeping us at the forefront of new developments in wireless technologies and industry requirements. We share our expertise with customers in several areas including design, engineering, and testing, and provide insights based on years of experience across hundreds of devices. By harnessing our specialized experience and expertise, we offer solutions that can improve our customers’ product performance, reduce their staff costs and allow our customers to focus on non-antenna related factors in the face of short design, engineering and production windows. Rather than rely upon a captive engineering group that only works on in-house opportunities, we act as an outsourced antenna design, engineering, and test group for our customers. We also bring years of experience in delivering high performance, ultra-reliable wireless connectivity for mobile, fleet, and IIoT and machine-to-machine, or M2M, applications.
Benefits to Wireless Users
By focusing on performance, we strive to improve product satisfaction with customers. Often, competing makers of wireless devices use chips that are made by the same semiconductor manufacturer. Antenna reliability depends on numerous factors including material, mount position, physical connection and resistance to oxidation. However, the selection and placement of an antenna, or antennas, can change the performance characteristics measurably. Each sale of a wireless solution is customized according to the needs and requirements of the customer. Tradeoffs exist on placement, power, price, and other variables. By focusing on performance, we challenge our engineers to deliver the optimal solution given the customer’s product constraints. This commitment to performance has established us as one of the recognized leaders in the design, testing, and performance of wireless systems, and led to what we believe is one of the broadest blue-chip customer lists in the industry.
Products
Our products are found in a broad range of applications and end-user devices that are deployed in carrier, fleet, enterprise, residential, private, government, and public safety wireless networks and systems, including set-top boxes, access points, routers, modems, gateways, media adapters, Wi-Fi extenders, portables, digital televisions, sensors, and fleet and asset tracking devices. Our products have been adopted by some of the world’s leading telecom manufacturers and networking companies and are now being used by millions of carrier subscribers in the
7
United States, Canada, Europe, and Asia Pacific. We offer several product categories designed to maximize the performance of wireless devices while providing cost and design flexibility:
8
Design Partnerships
We have entered into joint development efforts with WLAN chipset vendors to collaborate on next-generation WLAN reference designs, where we jointly pursue the development of reference design platforms optimized for use with integrated embedded antenna solutions. These WLAN reference designs are intended to provide ODMs with high performance, embedded antenna solutions that provide consistent, measurable results and provide a path to reduced product development costs and cycle times.
Our collaborative relationships with 802.11 chipset vendors offer opportunities for market access and improved sales of both chipsets and antennas. Early access to chipset vendors’ offerings, including industrial design tradeoffs in enclosure, board layout and design, all offer chipset vendors the advantage of optimized performance in their reference designs. When our antennas are consequently listed in the reference bill of materials for the major chipset vendors’ products, these antennas become the default performance recommendation for all products utilizing that chipset. Ongoing contact with the OEM’s and ODM’s, along with default use of the reference bill of materials components specified by chipset vendors, generates a dependable flow of sales opportunities for us.
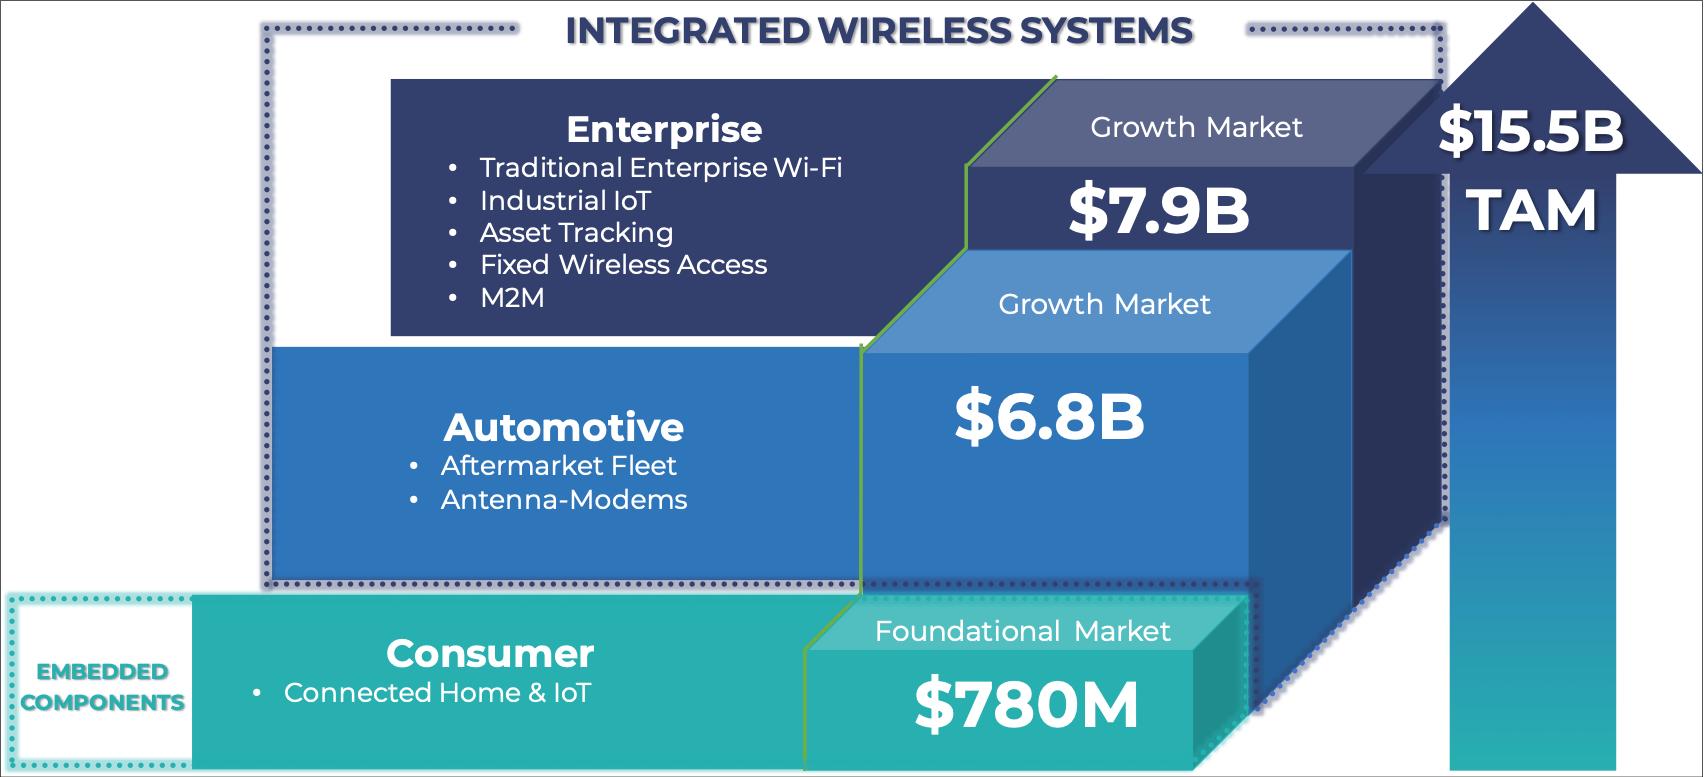
Growth Strategy
We are in the process of transitioning from a passive antenna and related services provider to a wireless system solutions provider, targeting higher levels of integration and complexity, and therefore, higher selling prices and margins. Climbing the value curve and expanding our presence in adjacent markets are key ingredients to our growth strategy. In terms of markets, our growth strategy is centered around targeting three key markets, specifically, consumer, enterprise and automotive. We consider our consumer market as foundational revenue, with enterprise and automotive markets representing our primary growth markets. The following graphic provides a summary of our estimated total addressable market within each of these three markets. As highlighted in the graphic below, based on ABI Research and our internal ASP estimates, by the end of 2022, we estimate a total addressable market, or TAM, to be in excess of $15.5 billion.
9
Within our foundational consumer market most of our revenue comes from gateways and routers that are sold to cable multiple system operators, or MSOs. While the MSO companies have faced “cord-cutting” in favor of over-the-top, or OTT, internet-based programming, the cord-cutting trends have not impacted the market for gateways and routers, as OTT devices still need access to the internet in the home through Wi-Fi via the gateway.
The transition towards Wi-Fi 5 and Wi-Fi 6 standards, and more recently the 6GHz extension to Wi-Fi 6, labelled Wi-Fi 6E is driving a new wave in device upgrades. The shift toward Gigabit Wi-Fi 6 is creating increased demand for our solutions as the number of antennas per device increases substantially. Wi-Fi 6 provides a theoretical ability to deliver speeds in excess of 14Gbps using 4x4 MIMO which is comparable to full duplex DOCSIS 3.1 and 5G bandwidths, resulting in wireless bandwidth delivery achieving parity with wireline speeds. Given the performance improvements over existing systems, service providers around the world are expediting their upgrade cycle towards higher performing consumer devices, driving a device design refresh cycle.
We continue to penetrate an increasing scope of adjacent wireless device applications within the consumer market such as home security, smart appliances, and connected healthcare devices. We are also expanding our footprint in these markets through support of an increasing range of IoT wireless standards, such as Bluetooth, ZigBee, Z-Wave, Thread, NB-IoT and LoRa WAN. Our engineering team provides custom antenna solutions to support a variety of device constraints, including flexible antenna technology for curved and smaller form factors, and specific absorption rate, or SARs, compliant antennas for body worn applications.
In the automotive market, the trend towards the ubiquitous connected car and the demand for increasingly complex aftermarket/fleet wireless connectivity solutions, are key growth drivers for us. The automotive market represents a significant growth opportunity both near and long term. Connected cars require embedded and external mounted antennas for a complete wireless solution. We have a leading portfolio of automotive antenna connectivity solutions, from embedded solutions for OBD II, IHU and connected car gateways, to custom ‘shark fin’ style antennas for automotive applications, mainly targeting mobile and automotive fleet applications for government, public safety, and enterprise applications. Our strategy is to continue to leverage our Antenna Plus brand in the North American fleet and public safety automotive aftermarket segments to generate near-term revenue. For longer term revenue growth opportunities, we are pursuing the European and other international aftermarket fleets and motorhome antenna markets. In 2020 we launched Centurion Next, the first of the 5G family with Wi-Fi 6 support, as part of the 5G refresh of our Antenna Plus fleet antenna product lines. For international markets, we obtained our first European compliance qualification in 2020 opening the door to the distribution of our 5G capable fleet and M2M antenna products.
10
Our new patented AirgainConnect antenna-modem platform is expected to be the biggest growth contributor to the automotive market. The first AirgainConnect product, the AC-HPUE, is currently one of only two HPUE products certified for use on the AT&T FirstNet network. AT&T activated the first HPUE on the FirstNet network in January 2021. While FirstNet primary users are first responders, there are extended-primary users from transit agencies; public-utility and tow-truck companies; school districts; a state child-protective-services agency, airports, and television/media news outlets. The AirgainConnect platform has the potential to address a very broad set of sub-market applications. In addition, AC-HPUE supports all AT&T LTE bands, so is usable with or without HPUE. We are developing our next generation AirgainConnect product to feature a global modem. The patented AirgainConnect AC-HPUE is the first HPUE antenna-modem product available for vehicles and we have certain exclusive rights to the use of the HPUE modem module from our partner Assured Wireless Corporation, for rooftop vehicular applications.
Within the enterprise market, we are targeting new 5G device programs primarily sub-6GHz, citizens broadband radio service, or CBRS, and Wi-Fi 6, for integrated smart antenna systems. This allows us to leverage our core competencies in advanced antenna designs in a market that offers significantly higher selling prices in the 10s of dollars to hundreds of dollars range. CBRS is driving new use cases including private LTE, leading to private 5G, and cellular operators for fixed wireless access, or FWA, and for secondary indoor spectrum. New 5G spectrum is creating opportunities for operators to establish or expand FWA offerings, to compete with wired incumbents, driving development of a new wave of 5G-enabled customer-premises equipment devices and small cells. The enterprise market is characterized by various submarket segments, each having different characteristics and therefore different growth strategies. Our strategy in the enterprise Wi-Fi submarket is to focus on customized embedded, and external antenna systems for the top two global OEMs in this market. In 2020 we were on-boarded as a supplier to a global leader in Enterprise Wi-Fi for the award of an active stand-alone high-gain Wi-Fi antenna system that we entered into volume production in Q3 2021. On the cellular side of the enterprise market, we are currently developing core 5G antenna systems designs and associated intellectual property, while being actively engaged in a new wave of 5G small cell and FWA device. We expect this trend in 5G enabled device opportunities to continue to ramp in 2022. Technical challenges relate to the complexity of integration and coverage of a broader range of frequency bands, including C-Band, new millimeter wave, or mmW 5G NR spectrum. Our first phase of active beam steering mmW 5G antenna technology was successfully demonstrated to our customers in a live demonstration at CES in January 2020.
Within the M2M and IoT infrastructure submarket of the enterprise market, serviced by our Antenna Plus products, we see expect to see growth in demand for in-building, out-building, and on-building connectivity solutions for commercial, retail, and office, outdoor kiosk, signage, and fixed asset connectivity and tracking. According to ABI research, by 2023, there will be approximately 12 million new M2M wireless modem shipments per year, up from approximately six million new modem shipments in 2018. We expect the addition of NimbeLink products to our portfolio to immediately help us drive growth in the IIoT segment of the enterprise market.
We provide a comprehensive set of services for single and multi-client OTA performance testing, characterization, and validation for wireless devices utilizing the common wireless standards including WLAN, Bluetooth, ZigBee, Z-Wave, LoRa, LTE, CBRS, and 5G. Our service offering includes early-stage system design, custom engineering support, and superior OTA testing services for service providers and OEMs. Our proprietary OTA testing process has become highly regarded in wireless throughput evaluation, enabling our service offering to create stickiness with customers as they depend on our testing services to evaluate their products. Some of our customers have implemented their own performance testing capability in-house, reducing their need to purchase OTA performance testing services from us, thereby limiting the growth potential of our services revenue in the enterprise market. Despite these challenges, we continue to see demand for these services and we plan to continue to leverage this offering to customers and applications in adjacent markets.
Over the next several years, we believe the adoption of 5G on a global basis will offer incremental growth opportunities for us. According to ABI Research, 25% of network traffic will be 5G by 2023. 5G wireless antenna systems are more complex and highly integrated as they need to support complex active architectures for new configurations such as active beam forming, and new frequency block allocations and auctions in the sub-6GHz and mmWave, frequency bands. We believe this shift in antenna complexity and integration will allow us to leverage our expertise and antenna performance, including integration between antenna and the RF front end, to enhance the value proposition to our customers. Furthermore, highly integrated and complex designs demanded by 5G will
11
require closer coordination between the ecosystem of component vendors, OEMs and Chipset Vendors, a key strength of ours.
In the United States we have a strong position with service providers, carriers, and MSO’s that supply in-home residential wireless equipment. That said, we believe there are growth opportunities on the international front. This includes Europe, especially in areas of the connected home and aftermarket automotive markets which will offer meaningful opportunities.
Our mission is to connect the world through advanced antenna systems and integrated wireless solutions. The key elements of our strategy are listed below.
Customers
Our customers are global. Our top customers, Synnex Technology International (HK) Ltd., Syntech Asia Ltd. and Get Wireless, LLC accounted for more than 45% of sales for the year ended December 31, 2021. We generally
12
work with Engineering, Product Management, Product Line Management, Product Marketing, Design, and similar groups to provide antenna solutions. While the sale of the product may be to an OEM and ODM, or via a distributor, we also consider our customers to include chipset vendors and service providers. We market our design capabilities directly to chipset vendors and service providers to generate demand.
13
Sales and Marketing
Our sales and marketing organizations work together closely to improve market awareness, build a strong sales pipeline, and cultivate ongoing customer relationships to drive sales growth.
Sales
Our global sales effort consists of direct and indirect sales teams, and indirect channel partners. Our direct sales team consists of inside sales personnel based in the United States, China and Taiwan and our outside field sales teams based in the United States, the United Kingdom, South Korea, China, and Taiwan. Our outside field sales teams consist of business, sales, account, technical marketing and program managers, and field application engineers, or FAEs. Our indirect channel partners consist of distributors, engineering design companies and outside sales representatives.
Our outside sales team is engaged in pre-sales, account management, and creating partnership opportunities with third parties such as service providers and semiconductor manufacturers. They are assigned quotas and have defined sales territories and/or accounts. The sales process includes meeting and qualifying potential programs and customers, and actively managing the planning stage of devices they plan to bring to market. Our FAEs assist these managers by providing technical support to existing customers.
Our indirect channel partners provide lead generation, pre-sales support, product fulfillment and, in certain circumstances, post-sales customer service and support. This channel partner network often co-sells with our inside sales and field sales teams. Our channel provides us with additional sales leverage by sourcing new prospects, providing technical support to existing customers, upselling for additional use cases and daily indexing capacities, and maintaining repeat business with existing customers. These channels provide added coverage to customers and prospects we cannot reach directly.
Marketing
Our marketing strategy is focused on building a competitive advantage for Airgain’s brands and products in the marketplace. We target two types of customers. For our embedded products, such as our embedded antennas and Skywire modems, we target design teams within OEMs and ODMs. For our integrated products, such as our asset trackers and AirgainConnect, we target end user markets. We use both direct and indirect promotional methods to engage our audiences. Direct methods include advertising, web properties, marketing collateral, email campaigns, paid and organic social media, search engine marketing, media relations, content marketing, direct mail, tradeshows and events, and general lead generation tactics. Indirect methods include co-marketing efforts together with resellers, distributors, system integrators, hardware and software partners, and carriers. Both are areas where we plan to invest greater efforts in the future.
The three primary goals of the marketing team are to uncover new opportunities in the marketplace, support any existing opportunities currently in the pipeline, and increase deal size by introducing customers and prospects to the breadth of our product line. We continue to see increased benefit from our marketing technology and marketing automation efforts in accomplishing these goals. In addition, digital channels have proven to be more effective in generating additional interest and leads for both the field sales team as well as the channel, so we will continue to shift our focus accordingly.
14
Competition
The antenna and wireless solutions market is highly competitive and is characterized by rapid technological change and evolving standards. Our principal competitors fall into four categories:
15
The principal competitive factors in our markets include:
We compete primarily based on antenna and RF system performance, our intellectual product portfolio, design and testing capabilities, and reputation. We believe we generally compete favorably on the basis of these factors. However, some of our existing and potential competitors may have advantages over us. Many of our competitors are significantly larger in scale than we are and have access to greater financial, technical, marketing, and other resources. In most instances, competition among these vendors creates some level of pricing pressure and forces us to lower prices below our established list prices. Many direct competitors compete primarily based upon price and do not provide the same level of design collaboration and services as we do. For example, some high-volume Asia-based competitors are prepared to operate at less than 20% gross product margins.
Manufacturing and Operations
We have had limited in-house manufacturing capability, solely with respect to antennas deployed in the fleet and M2M antenna market, where final assembly of these antenna products was performed at our facility located in Scottsdale, Arizona. However, we have recently determined to cease production at our Scottsdale facility in the first quarter of 2022, and at that point all of the manufacturing of our products will be done at contract manufacturers, or CMs, located in the United States, China, Vietnam, Mexico and Myanmar. We have long-term relationships with certain of these CMs, and work together to control raw materials, assembly, test, quality and shipment of our antenna products. We perform quality assurance and testing at our California and Scottsdale facilities and monitor the quality performance of our CMs through quality reports and periodic audits.
We maintain a close direct relationship with our CMs to help ensure supply and quality meet our requirements. The contract manufacturing services required to manufacture and assemble our products can be satisfied by one or more of our CMs, however it may be time consuming and costly to qualify and implement new CM relationships. If our CMs suffer an interruption in their businesses, or experiences delays, disruptions, or quality control problems in their manufacturing operations, or we otherwise need to change or add additional CMs or suppliers, our ability to ship products to our customers could be delayed, and our business could be adversely affected. Our qualified CMs manufacture antenna products according to our design specification, materials specification, quality standards, and delivery requirements. We have full control and authority over the selection of materials, manufacturing processes, and inspection processes. Since our products manufactured in China are predominantly shipped to ODM’s and CM’s within Asia, we have not experienced significant impact as a result of the tariffs imposed on exports from China to the United States. Furthermore, the recent supply disruptions and chip shortages have had and may continue to have a direct impact on our business.
16
Research and Development
We invest considerable time and financial resources in research and development to enhance our antenna design and system integration capabilities and conduct quality assurance testing to improve our technology. As of December 31, 2021, we had a total of 70 employees and dedicated representatives within our research and development organization representing approximately 48% of our workforce. Our engineering team consists of engineers located in research, design, and test centers in California, Arizona, and Florida, as well as the United Kingdom and China. Our engineering team actively participates in research and development activities to expand our capabilities and target applications for the consumer, enterprise and automotive markets. We expect to continually expand our product offerings and technology solutions over time and to continue to invest significantly in ongoing research and development efforts.
In the connected home, we are developing a series of antenna products for the home security market, including designs ranging from Z-Wave applications for door sensors to customized connectivity solutions for smart metering using LTE and LPWAN standards, and antenna modules enabling gigabit speed last meter connectivity for broadband operators. We continue to architect and improve our antenna systems for our enterprise class smart antenna customers, as well as new high performance designs for the outdoor Wi-Fi and small cell markets. We continually review alternative antenna designs for increasingly complex carrier gateway products, which are expanding beyond just delivering Wi-Fi to also include 5G, ZigBee, Z-Wave, DECT, LPWAN, NB-IoT and Bluetooth applications. Finally, we are engaged in the design and evaluation of antenna systems for next generation 802.11ax technology, including reference designs with industry leading chipset vendors.
Seasonality
Our operating results historically have not been subject to significant seasonal variations. However, our operating results are affected by how customers make purchasing decisions around local holidays in China. For example, a national holiday the first week of October in China may cause customers to purchase product in the third quarter ahead of their holiday season to account for higher volume requirements in the fourth quarter. In addition, although it is difficult to make broad generalizations, our sales tend to be lower in the first quarter of each year compared to other quarters due to the Chinese New Year. The broader economic impacts caused by the COVID-19 pandemic may contribute to the traditionally slower first quarter sales this year. Results for any quarter may not be indicative of the results that may be achieved for the full fiscal year and these patterns may change as a result of general customer demand or product cycles.
Intellectual Property
We rely on patent, trademark, copyright and trade secret laws, confidentiality procedures, and contractual provisions to protect our technology. As of December 31, 2021, we had 236 issued U.S. patents covering our products as well as our embedded and external antenna technology with expiration dates ranging from 2021 to 2039, and 13 pending patent applications in the United States Patent and Trademark Office. Outside of the United States we have 21 issued patents and 7 pending patent applications with expiration dates ranging from 2022 to 2037, which entail counterparts of U.S. patent applications. The patents consist of several broad areas as summarized by the following patent groups:
Taken together, these patents with priority dates as far back as November 2001 form both a barrier to competition and a licensable asset for customers in the MIMO and antenna assembly categories.
17
Despite our efforts to protect our proprietary rights, unauthorized parties may attempt to copy aspects of our products or obtain and use information that we regard as proprietary. We generally enter into confidentiality agreements with our employees, consultants, vendors and customers, and generally limit access to and distribution of our proprietary information. However, we cannot assure you that the steps taken by us will prevent misappropriation of our technology. In addition, the laws of some foreign countries do not protect our proprietary rights to as great an extent as the laws of the United States, and many foreign countries do not enforce these laws as diligently as government agencies and private parties in the United States.
Our industry is characterized by the existence of many patents and frequent claims and related litigation regarding patent and other intellectual property rights. In particular, leading companies in the technology industry have extensive patent portfolios. Third parties, including certain of these leading companies, may in the future assert patent, copyright, trademark and other intellectual property rights against us, our channel partners or our customers.
Employees
As of December 31, 2021, we had a total of 145 employees and dedicated representatives including 102 in the United States, 30 in China, 5 in Taiwan, 1 in South Korea and 7 in the United Kingdom. Among the total 145 employees and dedicated representatives, 18 of them were primarily engaged in manufacturing operations, 70 of them were primarily engaged in research and development, 39 of them were primarily engaged in sales and marketing and 18 of them were primarily engaged in general and administration functions. None of our employees are covered by a collective bargaining agreement or represented by a labor union. We consider our relationship with our employees to be good.
Available Information
We file electronically with the Securities and Exchange Commission, or SEC, our annual reports on Form 10-K, quarterly reports on Form 10-Q and current reports on Form 8-K pursuant to Section 13(a) or 15(d) of the Securities Exchange Act of 1934, as amended. We make available on our investor relations website at investors.airgain.com, free of charge, copies of these reports, as soon as reasonably practicable after we electronically file such material with, or furnish it to, the SEC. The public may read or copy any materials we file with the SEC at the SEC’s Public Reference Room at 100 F Street NE, Washington, D.C. 20549. The public may obtain information on the operation of the Public Reference Room by calling the SEC at 1-800-SEC-0330. The SEC maintains a website that contains reports, proxy and information statements, and other information regarding issuers that file electronically with the SEC. The address of that website is www.sec.gov.
We use our investor relations website as a means of disclosing material non-public, information and for complying with our disclosure obligations under Regulation FD. Investors should monitor such website, in addition to following our press releases, SEC filings and public conference calls and webcasts. Information relating to our corporate governance is also included on our investor relations website. The information in or accessible through the SEC and our website are not incorporated into, and are not considered part of, this filing. Further, our references to the URLs for these websites are intended to be inactive textual references only.
18
ITEM 1A. RISK FACTORS
You should carefully consider the following risk factors, together with the other information contained in this annual report on Form 10-K, including our financial statements and the related notes and “Management’s Discussion and Analysis of Financial Condition and Results of Operations,” before making a decision to purchase or sell shares of our common stock. We cannot assure you that any of the events discussed in the risk factors below will not occur. These risks could have a material and adverse impact on our business, results of operations, financial condition and growth prospects. If that were to happen, the trading price of our common stock could decline. Additional risks and uncertainties not presently known to us or that we currently deem immaterial also may impair our business operations or financial condition.
Summary of Risks Related to our Business
Our business is subject to numerous risks and uncertainties, including those described below. The principal risks and uncertainties affecting our business include, but are not limited to the following:
Risks Related to Our Business and Industry
The markets for our antenna solutions are developing and may not develop as we expect.
The wireless industry is characterized by rapidly evolving technologies, and the markets for our antenna systems and wireless connectivity solutions may not develop as we expect. It is difficult to predict customer adoption rates, customer demand for our antennas, the size and growth rate of our target markets, the entry of competitive products, or the success of existing competitive products. We have historically driven revenue growth
19
primarily through the top North American video service providers, largely in the consumer market. Moving forward, our goal is to drive growth in the enterprise and automotive markets. These markets may develop at varying growth rates and our success in penetrating these markets will depend on various competitive factors across a number of developing industries. Any expansion in our markets depends on several factors. For example, the continued growth in the consumer market and any increase in demand for antenna products will depend on, among things, the cost, performance, and perceived value associated with our antennas and the ability for our antenna products to meet increased performance demands, refresh cycles and device form factors. Further, as we continue to transition to a wireless systems solution provider, increased growth in the enterprise and automotive markets will depend on, among things, acceptance of our solutions by our customers and performance of the networks on which our products operate. For example, the market for our AirgainConnect AC-HPUE product is highly dependent on the overall first responders market and AT&T’s FirstNet network, and this market has not to date resulted in significant sales of our product and the market may not further develop on the timeframes we expect, or at all.
If our wireless solutions do not achieve widespread adoption, if there is a slower rollout than we expect in certain markets or there is a reduction in demand for our wireless connectivity solutions or antennas in our markets caused by a lack of customer acceptance, technological challenges, competing technologies and products, decreases in corporate spending, weakening economic conditions, or otherwise, it could result in reduced customer orders, early order cancellations, or decreased sales, any of which would adversely affect our business, operating results and financial condition.
Our operating results may fluctuate significantly, which makes our future operating results difficult to predict and could cause our operating results to fall below expectations or our guidance.
Our quarterly and annual operating results have fluctuated in the past and may fluctuate significantly in the future, which makes it difficult for us to predict our future operating results. The timing and size of sales of our products are variable and difficult to predict and can result in fluctuations in our net sales from period to period. In addition, our budgeted expense levels depend in part on our expectations of future sales. Because any substantial adjustment to expenses to account for lower levels of sales is difficult and takes time, we may not be able to reduce our costs sufficiently to compensate for an unexpected shortfall in net sales, and even a small shortfall in net sales could disproportionately and adversely affect our operating margin and operating results for a given quarter.
Our operating results may also fluctuate due to a variety of other factors, many of which are outside of our control, including the changing and volatile U.S., European, Asian and global economic environments, and any of which may cause our stock price to fluctuate. Besides the other risks in this “Risk Factors” section, factors that may affect our operating results include:
20
The cumulative effects of the factors above could result in large fluctuations and unpredictability in our quarterly and annual operating results. For example, the ongoing tension on global trade and macroenvironment are impacting the whole supply chain to varying degrees, which, in addition to the slowdown in customer specific product rollouts, has negatively affected our business and may continue to do so. In 2021 a global supply shortage caused a delay in customer specific rollouts and a delay in our ability to source required components for certain of our products, as well as the ability of our customers to source required components for end products that incorporate our products. These supply chain interruptions have caused and may continue to result in a delay in our sales, as well as fluctuations in timing of our supply chain purchases as we look to secure components in advance to account for longer lead times. Together with inflationary and other effects, this has resulted and may continue to result in higher prices from our suppliers that have negatively affected, and could continue to negatively affect, gross margins and operating expenses. As a result, comparing our operating results on a period-to-period basis may not be meaningful. You should not rely on our past results as an indication of future performance.
In addition, the financial markets and the global economy may be adversely affected by the current or anticipated impact of military conflict, including the conflict between Russia and Ukraine, terrorism or other geopolitical events. Sanctions imposed by the United States and other countries in response to such conflicts, including the one in Ukraine, may also adversely impact the financial markets and the global economy, and any economic countermeasures by affected countries and others could exacerbate market and economic instability. There can be no assurance that further deterioration in credit and financial markets and confidence in economic conditions will not occur. Our general business strategy and operating results may be adversely affected by any such economic downturn, volatile business environment, or continued unpredictable and unstable market conditions. In addition, there is a risk that one or more of our current manufacturers, suppliers or customers may not survive an economic downturn, which could adversely affect our business and operating results.
Our antenna solutions and wireless connectivity solutions are subject to intense competition, including competition from the customers to whom we sell.
Antenna solutions is an established technical field with low intellectual property and technological barriers to entry. Antenna competition exists globally for all areas of our business and product lines. The markets in which we compete are rapidly evolving and intensely competitive, and we expect competition to increase in the future from established competitors and new market entrants. The markets are influenced by, among others, brand awareness and reputation, price, strength and scale of sales and marketing efforts, professional services and customer support, product features, reliability and performance, scalability of products, and breadth of product offerings. Due to the proprietary nature of some of our products, competition occurs primarily at the design stage. As a result, a design win by our competitors or by us typically limits further competition regarding that design. This competition could result in increased pricing pressure, reduced profit margins, increased sales and marketing expenses and failure to increase, or the loss of, market share, any of which would likely seriously harm our business, operating results or financial condition. In addition, some of our ODM, OEM and carrier and retail-focused end-customers that drive the use of our antenna solutions have and, in the future, may build internal antenna design teams that compete with our products. From a cost and control perspective, our products generally cost more than our competitors’ products. If our ability to design antenna solutions is deemed to be on par or of lesser value than competing solutions, we could lose our customers and prospects.
Additionally, our movement into more system-based solutions may bring more competitors into our markets than we have traditionally faced. As our solutions begin to contain more system components and commensurate higher average selling prices, the resulting product categories may attract additional competitors or our customers
21
may be more likely to begin to develop competing products. Our AirgainConnect product is the only HPUE antenna-modem certified by AT&T for the FirstNet network, and currently one of only two HPUE products certified by AT&T for FirstNet MegaRange, with the other such product being a stand-alone modem product marketed by our supplier of the HPUE modem module, and so our supplier competes with us for sales to certain customers. While we believe our intellectual property estate and limited exclusivity agreement with Assured Wireless for use of their HPUE modem module in a vehicular antenna-modem product provide us a competitive advantage, we cannot assure you that other competitors will not enter the market and limit the growth potential of our AirgainConnect platform. Our exclusivity with Assured Wireless is limited in duration and subject to termination if we fail certain of our obligations under our agreement. In addition, if our relationship with Assured Wireless is terminated, or AT&T decertifies our products on its networks, our business and operating results and financial condition may be materially affected.
New entrants and the introduction of other distribution models in our markets may harm our competitive position.
The markets for development, distribution, and sale of our products are rapidly evolving. New entrants seeking to gain market share by introducing new technology and new products may make it more difficult for us to sell our products, and could create increased pricing pressure, reduced profit margins, increased sales and marketing expenses, or the loss of market share or expected market share, any of which may significantly harm our business, operating results and financial condition.
Our future success depends on our ability to develop and successfully introduce new and enhanced products and services for the wireless market that meet the needs of our customers.
Our sales depend on our ability to anticipate our existing and prospective customers’ needs and develop products that address those needs. Our future success will depend on our ability to introduce new products for the wireless market, anticipate improvements and enhancements in wireless technology and wireless standards, and to develop products that are competitive in the rapidly changing wireless industry. In furtherance of these efforts, we expect to invest significantly in ongoing research and development. If we do not adequately fund our research and development efforts, or if our research and development investments do not translate into material enhancements to our antenna products, we may not be able to compete effectively and our business, results of operations, and financial condition may be harmed. As we transition to a wireless systems solutions provider, we anticipate the need to increase our investment in research and development to stay on the leading edge of next generation development and to alight ourselves with the rapidly evolving technology needs of the industry. Moreover, the introduction of new products and product enhancements will require coordination of our efforts with those of our customers, suppliers, and manufacturers to rapidly achieve volume production and to support those products when they are in the field. We expect these coordination efforts to increase substantially in the future as we work with chipset vendors and OEM partners on new proof-of-concept and reference designs earlier in the development cycle. If we fail to coordinate these efforts, develop product enhancements or introduce new products that meet the needs of our customers as scheduled, our operating results will be materially and adversely affected, and our business and prospects will be harmed. We cannot assure that product introductions will meet the anticipated release schedules or that our wireless products will be competitive in the market.
In May 2020 we announced the AirgainConnect platform, including AirgainConnect AC-HPUE, an integrated FirstNet Ready high-power LTE modem. The introduction of the AirgainConnect platform represents a new platform that integrates high-power mobile modem technology with an antenna into the same package, enabling performance for 4G and 5G communications. The introduction of the new AirgainConnect platform, and the transition to a more expansive level of advanced product solutions, will require coordination of efforts and increased time and resources. If we fail to gain market acceptance with our customers, suppliers and manufacturers, our operating results will be materially and adversely affected, and our business and prospects will be harmed.
Furthermore, given the rapidly evolving nature of the wireless market, there can be no assurance our products and technology will not be rendered obsolete by alternative or competing technologies. The markets in which we operate are characterized by changing technology and evolving industry standards, which includes the introduction and implementation of Wi-Fi 6 and emerging 5G cellular standards. Despite years of experience in meeting customer design requirements with the latest in technological solutions, we may not be successful in identifying, developing and marketing products or systems that respond to rapid technological change, evolving technical
22
standards and systems developed by others. Our competitors may develop technology that better meets the needs of our customers. If we do not continue to develop, manufacture and market innovative technologies or applications that meet customers’ requirements, sales may suffer, and our business may not continue to grow in line with historical rates or at all.
Our embedded antenna solutions business is characterized by short product development windows and short product lifecycles.
Certain of our antenna solutions are purchased and integrated by customers in the electronics industry. In many cases, the products that include our solutions are subject to short product development windows and short product lifecycles. In the case of the short product development window, we may be pressured to provide solutions that are the lowest in cost to be accepted. Customer pressure could force us to reduce our price to win designs with short development windows. Regarding short product lifecycles, we might provide up-front design and engineering work, but ultimately lose the design to a competitor, or even if we win the design, such design could be extremely short-lived due to our customers’ inability to sell the product in significant volume. Our up-front costs associated with a design can be significant, particularly for new and emerging technology trends and industry standards, and if the sales volumes are inadequate due to lack of acceptance and/or short lifecycle, our financial performance will be impaired. Additionally, these products are dependent on the demand for and sales of the customers’ products, and any issues our customers suffer with their product sales could have an adverse impact on our sales.
Any delays in our sales cycles could result in customers canceling purchases of our products.
Sales cycles for some of our products can be lengthy, often lasting several months to a year or longer. In addition, it can take additional time before a customer commences volume production of equipment that incorporates our products. Sales cycles can be lengthy for several reasons, including:
A significant portion of our operating expense is relatively fixed and is based in large part on our forecasts of volume and timing of orders. The lengthy sales cycles make forecasting the volume and timing of product orders difficult. In addition, the delays inherent in lengthy sales cycles raise additional risks of customer decisions to cancel or change product phases. If customer cancellations or product changes were to occur, this could result in the loss of anticipated sales without sufficient time for us to reduce our operating expenses. We currently maintain significant inventories to meet forecasted future demand due to the supply chain shortages. If the forecasted demand does not materialize into purchase orders for these products, we may be required to write off our inventory balances or reduce the value of our inventory, based on a reduced sales price. A write off of the inventory, or a reduction in the inventory value due to a sales price reduction, could have an adverse effect on our financial condition and operating results.
We have a history of losses, and we may not be profitable in the future.
Before 2013 we had incurred net losses in each year since our inception. As a result, we had an accumulated deficit of $57.4 million at December 31, 2021. Because the market for our antenna products is rapidly evolving, it is difficult for us to predict our operating results. We expect our operating expenses to increase over the next several years as we hire additional personnel, particularly in engineering, sales, and marketing, and continue to develop new antenna products to address new and evolving markets. In addition, as a public company we will incur additional significant legal, accounting, and other expenses. If our sales do not increase to offset these increases in our operating expenses, we may not be profitable in future periods. Our historical sales growth has been inconsistent and
23
should not be considered indicative of our future performance. Any failure to sustain or increase our profitability consistently could cause the value of our common stock to materially decline.
A limited number of customers and devices represent a significant portion of our sales. If we were to lose any of these customers or devices, our sales could decrease significantly.
Our top customers, Synnex Technology International (HK) Ltd., Syntech Asia Ltd., and GetWireless, LLC accounted for more than 45% of sales for the year ended December 31, 2021. Although our top customers that pay for our products have historically been ODMs and distributors, it is primarily the OEMs, carrier customers and retail-focused end-customers that drove the use of our antenna solutions and the purchase by the ODMs and distributors of our antenna solutions. In addition, a few end-customer devices which incorporate our antenna products comprise a significant amount of our sales, and the discontinuation or modification of such devices may materially and adversely affect our sales and results of operations. Moving forward, as we transition to a wireless system solutions provider, we expect a shift toward external wireless solutions and antenna technologies in the automotive and enterprise markets that may result in a corresponding shift in the customer mix. Any significant loss of, or a significant reduction in purchases by, these other significant customers or customers that drive the use of our antenna solutions or a modification or discontinuation of a device which constitutes a significant portion of sales could have an adverse effect on our financial condition and operating results.
We sell to customers who are price conscious.
Our customers compete in segments of the electronics market. The electronics market is characterized by intense competition as companies strive to come to market with innovative designs that attract customers based upon design, performance, cost, ease of use, and convenience. Product lifecycles can be extremely short as companies try to gain advantage over their competitors. Because of the high design and engineering costs, companies that are customers or prospects for antenna solutions are cost conscious. As a result, our customers and prospects demand price cuts in established products and negotiate aggressively for lower pricing on new products. Because of the intense competition in the antenna solution market, we encounter situations that lead to difficult price negotiations potentially resulting in lower margins than forecast. Our products generally cost more than our competitors’ products. To address these pricing constraints and remain competitive, we must consistently design high quality antenna solutions that are deemed a better value than competing solutions, while also decreasing costs.
Our financial condition and results of operations could be adversely affected by outbreak of contagious disease such as the COVID-19 pandemic which has had an impact on our business operations and our business could continue to be materially affected, directly or indirectly.
Our business could be adversely affected by the effects of a widespread outbreak of contagious disease, including the outbreak of COVID-19, which has created considerable instability and disruption in the U.S. and world economies. The continued spread of COVID-19 and its related effects on our business have had a material and adverse effect on our business operations and our business could continue to be materially affected, directly or indirectly.
Governmental authorities in impacted regions have taken actions in an effort to slow COVID-19’s spread, resulting in business closures and a limit on consumer and employee travel. Any outbreak of contagious diseases, and other adverse public health developments could have a material and adverse effect on our business operations. In late January 2020, in response to intensifying efforts to contain the spread of COVID-19, we began to monitor or modify our hours of operation and the hours of our employees based in China, as did our contract manufacturers. As the situation progressed and the outbreak was stabilized in China, our workers and facilities, as well as those of our contract manufacturers, returned to full function with precautions in place to help prevent outbreak or spread of the virus. In the United States, most of our employees in the San Diego office are working from home and our offices are reserved for only those who cannot perform certain functions remotely, such as prototyping and testing. In accordance with local regulations, engineering, testing, and production operations in our Scottsdale office, as well as testing operations in our remote facilities, have resumed with protocols in place to prevent and limit the spread of the virus. In each work location, protocols have been established and remain in place, in accordance with government guidance, in order to minimize the risk to those employees whose presence in the office is necessary or allowed. Our sales representatives continue to engage with customers in order to secure sales of, and opportunities for, our products and services, often remotely rather than in-person. Specifically, the COVID-19 pandemic has
24
caused, and may continue to cause, a disruption and restrictions on our ability to travel, temporary closures of our office buildings and the facilities of our customers or suppliers, cancellations or modification of key industry marketing events, and disruptions with our contract manufacturers and suppliers located in Asia. Related to sales, we have also seen disruptions and delays in shipments and product launches, although orders have begun to rebound as of the second and third quarter of 2020. Such disruptions of our customers, suppliers, and contract manufacturers have had a negative impact on our sales and operating results and may continue to have a negative effect in future quarters.
The impact of the COVID-19 pandemic on the U.S. and world economies generally, and our future results in particular, could be significant and will largely depend on future developments, which are highly uncertain and cannot be predicted at this time. To the extent the COVID-19 pandemic continues to adversely affect our business and financial results, it may also have the effect of heightening many of the other risks described in this “Risk Factors” section.
We generally rely on a limited number of contract manufacturers to produce and ship our products, and the failure to manage our relationships with these parties successfully could adversely affect our ability to market and sell our products.
We have limited manufacturing capability, solely with respect to antennas deployed in the fleet automotive market for which we primarily manufacture in our facilities in Scottsdale, Arizona. For all of our other products, we outsource the manufacturing, assembly and testing of products. We historically relied on two contract manufacturers, which are located in China, to manufacture, control quality of, and ship our products. We have over the past two years engaged additional contract manufacturers outside of China, including Vietnam, Myanmar, and Mexico, to expand our capacity, and to diversify the countries in which our products are manufactured. We have also recently engaged two additional contract manufacturers as we transition away from our in-house manufacturing of products for the fleet automotive market and with the acquisition of NimbeLink, we added a contract manufacturer in the United States. We do not have long-term contracts with these manufacturers that commit them to manufacture products for us and we have limited direct control over their activities. In addition, we may experience delays or quality issues as we begin to ramp up our new contract manufacturers and transition production from our Scottsdale facility to contract manufacturers. Furthermore, political unrest in Myanmar, or political instability or military conflict in any country in which our CMs are located, may have an adverse effect on our contract manufacturer’s ability to deliver quality products on time. Any significant change in our relationship with these manufacturers could have a material adverse effect on our business, operating results, and financial condition. We make substantially all of our purchases from our contract manufacturers on a purchase order basis. Our contract manufacturers are not required to manufacture our products for any specific period or in any specific quantity. We expect that it would take approximately six to nine months to transition manufacturing, quality assurance, and shipping services to new providers. Relying on contract manufacturers for manufacturing, quality assurance, and shipping also presents significant risks to us, including the inability of our contract manufacturers to:
As we transfer the manufacture of products at our Scottsdale facility to contract manufacturers we may not be able to receive products with consistent and satisfactory quality or in sufficient quantities to meet demand. We also may experience delays or disruptions at our manufacturing facilities, which could result in delays of product shipments to our customers. Any failure by us or our contract manufacturers to timely deliver products of satisfactory quality or in sufficient quantities in compliance with applicable laws could hurt our reputation, cause
25
customers to cancel orders or refrain from placing new orders for our products, which could have a material adverse effect on our business, operating results, and financial condition.
We may experience delays in obtaining product from manufacturers and may not be a high priority for our manufacturers.
The ability and willingness of our contract manufacturers to perform is largely outside of our control. We believe that our orders may not represent a material portion of our contract manufacturers’ total orders and, as a result, fulfilling our orders may not be a priority if our contract manufacturers are constrained in their abilities or resources to fulfill all of their customer obligations in a timely manner. If any of our contract manufacturers suffers an interruption in its business, experiences delays, disruptions, or quality control problems in its manufacturing operations or we have to change or add additional contract manufacturers, our ability to ship products to our customers would be delayed and our sales could become volatile and our cost of sales may increase. For example, throughout 2021, we experienced a disruption in our supply chain for certain components located in Asia and made several purchases of available inventory in order to secure supply for our customers, sometimes at higher than our traditional prices. In addition, in the first and second quarters of 2021, NimbeLink transitioned the manufacture of certain products from existing manufacturers in the United States and China to Vietnam. Additionally, any or all of the following could either limit supply or increase costs, directly or indirectly, to us or our contract manufacturers:
For example, in the first quarter of 2021 we experienced delays for certain of our product shipments from China as a result of the extension of the lunar new year holidays due to the COVID-19 pandemic. We cannot predict with certainty whether such delays will occur in the future, and although we are monitoring the situation, it is currently unknown whether the pandemic will continue to disrupt our product shipments or impact manufacturing in the region over a prolonged period. Furthermore, throughout 2021, NimbeLink has experienced certain supply constraints and delays at the module supplier level due to a global shortage of semiconductor chips, and further shortages could result in a failure to provide timely delivery to our customers. If such disruption were to extend over a prolonged period, it could have a material impact on our sales and business and those of our customers.
Our contract manufacturers purchase some components, subassemblies and products from a single or limited number of suppliers. The loss of any of these suppliers may substantially disrupt our ability to obtain orders and fulfill sales as we design in and qualify new components.
We rely on third-party components and technology to build and operate our products, and we rely on our contract manufacturers to obtain the components, subassemblies, and products necessary for the manufacture of certain of our products. Throughout 2021, we have experienced shortages in supply of components we use in our products. A continuation of such shortages or other supply disruptions are possible, as well as inflation of prices of certain components, and our ability to predict the availability and pricing of such components is limited. Over the past two years, there have been and continue to exist shortages of certain electronic components used in our industry that have led to longer than normal lead times for the manufacture of certain components in some of our products. If shortages continue or occur in the future, as they have in the past, our business, operating results and financial condition would be materially adversely affected. Unpredictable price increases of such components due to market demand may continue to occur as well. While components and supplies are generally available from a variety of sources, we and our contract manufacturers depend on a single or limited number of suppliers for several components for our products. Further, certain products may utilize custom components available from only one or a limited number of sources. When a component or product uses new technologies, capacity constraints may exist
26
until the suppliers’ manufacturing capacity has increased. Many factors may affect the continued availability of these components at acceptable prices, including if those suppliers decide to concentrate on the production of common components instead of components customized to meet our requirements. There is no assurance that the supply of such components will not be delayed or constrained. If our suppliers of these components or technology were to enter into exclusive relationships with other providers of wireless networking equipment or were to discontinue providing such components and technology to us and we were unable to replace them cost effectively, or at all, our ability to provide our products would be impaired. Additionally, poor quality in any of the single or limited sourced components in our products could result in lost sales or lost sales opportunities. We and our contract manufacturers generally rely on purchase orders rather than long-term contracts with these suppliers. As a result, even if available, we and our contract manufacturers may not be able to secure sufficient components at reasonable prices or of acceptable quality to build our products in a timely manner. Therefore, we may be unable to meet customer demand for our products, which would have a material adverse effect on our business, operating results, and financial condition.
We rely significantly on channel partners to sell and support our products, and the failure of this channel to be effective could materially reduce our sales.
We believe that establishing and maintaining successful relationships with these channel partners is, and will continue to be, important to our financial success. Recruiting and retaining qualified channel partners and training them in our technology and product offerings require significant time and resources. To develop and expand our channel, we must continue to scale and improve our processes and procedures that support our channel partners, including investment in systems and training.
Existing and future channel partners will only work with us if we are able to provide them with competitive products on terms that are commercially reasonable to them. If we fail to maintain the quality of our products or to update and enhance them, existing and future channel partners may elect to work instead with one or more of our competitors. In addition, the terms of our arrangements with our channel partners must be commercially reasonable for both parties. If we are unable to reach agreements that are beneficial to both parties, then our channel partner relationships will not succeed.
We have no minimum purchase commitments with any of our channel partners, and our contracts with channel partners do not prohibit them from offering products or services that compete with ours, including products they currently offer or may develop in the future and incorporate into their own systems. Some of our competitors may have stronger relationships with our channel partners than we do, and we have limited control, if any, as to whether those partners use our products, rather than our competitors’ products, or whether they devote resources to market and support our competitors’ products, rather than our offerings.
The reduction in or loss of sales by these channel partners could materially reduce our sales. If we fail to maintain relationships with our channel partners, fail to develop new relationships with other channel partners in new markets, fail to manage, train or incentivize existing channel partners effectively, fail to provide channel partners with competitive products on terms acceptable to them, or if these channel partners are not successful in their sales efforts, our sales may decrease and our operating results could suffer.
Defects in our products or poor design and engineering services could result in lost sales and subject us to substantial liability.
Our advanced wireless connectivity technologies and systems are a critical element in determining the operating performance of our customers’ products. If our connectivity solutions perform poorly, whether due to design, engineering, placement, failure to properly support the products, or other reasons, we could lose sales. In certain cases, if our connectivity solutions are found to be the component that leads to failure or a failure to meet the performance specifications of our customer, we could be required to pay monetary damages to our customer. Real or perceived defects or errors in our connectivity solutions could result in claims by channel partners and customers for losses they sustain. If channel partners or customers make these types of claims, we may be required, or may choose, for customer relations or other reasons, to expend additional resources to help correct the problem, including warranty and repair costs, process management costs and costs associated with remanufacturing our inventory. Liability provisions in our standard terms and conditions of sale may not be enforceable under some circumstances or may not fully or effectively protect us from claims and related liabilities and costs. In addition, regardless of the
27
party at fault, errors of these kinds divert the attention of our engineering personnel from our product development efforts, damage our reputation and the reputation of our products, cause significant customer relations problems and can result in product liability claims. We maintain insurance to protect against certain types of claims associated with the use of our products, but our insurance coverage may not adequately cover any such claims. In addition, even claims that ultimately are unsuccessful could result in expenditures of funds in connection with litigation and divert management’s time and other resources. We also may incur costs and expenses relating to a recall of one or more of our products.
The process of identifying recalled products that have been widely distributed may be lengthy and require significant resources, and we may incur significant replacement costs, contract damage claims from our customers and significant harm to our reputation. The occurrence of these problems could result in the delay or loss of market acceptance of our products and could adversely affect our business, operating results and financial condition.
The loss of key personnel or an inability to attract, retain and motivate qualified personnel may impair our ability to expand our business.
Our success depends upon the continued service and performance of our senior management team and key technical, marketing and production personnel. For example, in February 2022, we announced that David Lyle, our Chief Financial Officer and Secretary, resigned effective March 1, 2022, and would provide consulting services until we filed this annual report on Form 10-K. The replacement of Mr. Lyle and any other members of our senior management team or other key employees or consultants likely will involve significant time and costs and may significantly delay or prevent the achievement of our business objectives.
Our future success also depends, in part, on our ability to continue to attract, integrate and retain highly skilled personnel. Competition, especially our design and technical personnel. As the source of our technological and product innovations, our design and technical personnel represent a significant asset. Any inability to retain, attract or motivate such personnel could have a material adverse effect on our business and results of operations. Further,
28
competition for highly skilled personnel is frequently intense. Any difficulties in obtaining or retaining human resource competencies we need to achieve our business objectives may have an adverse effect on our performance.
The terms of our amended and restated loan and security agreement place restrictions on our operating and financial flexibility. If we raise additional capital through debt financing, the terms of any new debt could further restrict our ability to operate our business.
We and our subsidiary NimbeLink have a $4.0 million revolving line of credit under a loan and security agreement with Silicon Valley Bank. Loans under the agreement are secured by a lien covering substantially all of our and NimbeLink’s properties, rights and assets, excluding intellectual property. As of the date of this annual report, the revolving line of credit was undrawn. The loan and security agreement contains customary affirmative and negative covenants and events of default applicable to us, NimbeLink and our respective subsidiaries, if any. The affirmative covenants include, among others, covenants requiring us and NimbeLink (and us and NimbeLink to cause our subsidiaries) to maintain our legal existence and governmental approvals, deliver certain financial reports, maintain insurance coverage, keep inventory, if any, in good and marketable condition and protect material intellectual property. The negative covenants include, among others, restrictions on us, NimbeLink and our respective subsidiaries transferring collateral, incurring additional indebtedness, engaging in mergers or acquisitions, paying dividends or making other distributions, making investments, creating liens, selling assets and making any payment on subordinated debt, in each case subject to certain exceptions. We and NimbeLink will be jointly and severally obligated to repay all credit extensions and other obligations regardless of whether we or NimbeLink, as the case may be, received the credit extension. If we or NimbeLink default under the facility, the lender may accelerate all of our and NimbeLink’s repayment obligations and take control of our and NimbeLink’s pledged assets, potentially requiring us and NimbeLink to renegotiate our agreement on terms less favorable to either of us or to immediately cease operations. Further, if we are liquidated, the lender’s right to repayment would be senior to the rights of the holders of our common stock to receive any proceeds from the liquidation. The lender could declare a default upon the occurrence of any event that it interprets as a material adverse effect as defined under the agreement, thereby requiring us or NimbeLink to repay the loan immediately or to attempt to reverse the declaration of default through negotiation or litigation. Any declaration by the lender of an event of default could significantly harm our business and prospects and could cause the price of our common stock to decline. If we raise any additional debt financing, the terms of such additional debt could further restrict our operating and financial flexibility.
We are subject to the risk that third-party consultants will not perform their tasks effectively and that we will be unsuccessful in operating our business as a result.
We have in the past relied on third parties, such as sales consultants and engineering contractors, for a portion of the design and sales and marketing of our products. In the future, we may rely on third-party consultants in addition to our own employees to perform the daily tasks necessary to operate our business in certain areas, including sales and engineering, and cannot ensure that third-party consultants will be able to complete their work for us in a timely manner. The failure of any third-party consultants to perform as anticipated could result in substantial costs, divert management’s attention from other strategic activities, or create other operational or financial problems for us. Terminating or transitioning arrangements with key consultants could result in additional costs and a risk of operational delays, potential errors and possible control issues as a result of the termination or during the transition. Accordingly, our reliance on third parties exposes us to the risk that our business will be unsuccessful if they do not design and sell our product as expected.
Our acquisitions expose us to risks that could adversely affect our business and adversely affect our operating results, financial condition, and cash flows.
As part of our strategy to develop and identify new products, services and technologies, we have made, and may continue to make, acquisitions of select assets and businesses. For example, we completed the acquisition of NimbeLink in January 2021 and we acquired the Antenna Plus assets in April 2017. We may not be able to integrate any acquired business that we may acquire successfully or operate such acquired business profitably. Integrating any newly acquired business could be expensive and time-consuming. Integration efforts often take a significant amount of time, place a significant strain on managerial, operational and financial resources and could prove to be more difficult or expensive than predicted. The diversion of management’s attention and any delay or difficulties encountered in connection with any future acquisitions we may consummate could result in the disruption of
29
on-going business or inconsistencies in standards and controls that could negatively affect our ability to maintain third-party relationships.
When pursuing acquisitions, we may not be able to find suitable acquisition candidates, and we may not be able to complete such acquisitions on favorable terms, if at all. Moreover, we may need to raise additional funds through public or private debt or equity financing, or issue additional shares, to acquire any businesses or products, which may result in dilution for stockholders or the incurrence of indebtedness. Any acquisitions we complete, may not ultimately strengthen our competitive position or achieve our goals, and could be viewed negatively by our end-customers, investors and financial analysts. Acquisitions involve many risks. An acquisition may negatively affect our operating results, financial condition or cash flows because it may require us to incur charges or assume substantial debt or other liabilities, may cause adverse tax consequences or unfavorable accounting treatment, may expose us to claims and disputes by third parties, including intellectual property claims and disputes, or may not generate sufficient financial return to offset additional costs and expenses related to the acquisition.
Our business may suffer if our strategic alliances are not successful.
We enter into strategic alliances and other relationships with companies whose capabilities complement our own. The objectives and goals for a strategic alliance can include one or more of the following: technology exchange, product development, joint sales and marketing, or new-market creation. To be successful, we must first be able to define, identify and secure alliance partners which align with our growth and technological plans. We cannot be certain that our alliance partners will provide us with the support we anticipate, or that such alliance or other relationships will be successful in creating new or improved products. Our success is also highly dependent upon our ability to manage the alliances, promote the benefits to us, and to not prohibit or discourage other opportunities which may be beneficial to us in the future. Also, certain provisions of alliance agreements may include restrictions that limit our ability to independently pursue or exploit the developments under such strategic alliances. If a strategic alliance fails to perform as expected or if the relationship is terminated, we could experience delays in new product development or impairment of our relationships with customers, and our ability to develop new solutions in response to industry trends or changing technology may be impaired and our results of operations could be adversely affected.
We are developing a number of our new products and wireless connectivity solutions in partnership with other companies. If any of these companies were to fail to perform, or our partnerships were to be unsuccessful, we may not be able to bring our product solutions to market successfully or on a timely basis.
We have partnered, and expect to continue to partner, with certain companies to further advance or develop our wireless connectivity solutions and develop or expand on new and existing technologies. These arrangements involve the commitment by each company of various resources, including technology, and research and development. If these arrangements do not develop as expected, especially those that involve our proprietary technologies, or if the products and/or services produced by our partners do not meet the required quality standards, our ability to introduce new antenna products and wireless connectivity solutions successfully and on schedule may be limited. Further, we cannot provide any assurances that our existing partnerships will be maintained successfully or at all, the failure of which could have a material adverse effect on our business and results of operations. For example, we rely on Assured Wireless Corporation and the ability to utilize AT&T's FirstNet platform in order to deliver reliable connections across our AirgainConnect platform. If Assured Wireless Corporation has any technical difficulties, if our partnership with them does not continue to develop, or if the technology developed in partnership with Assured Wireless Corporation does not develop or perform as expected, our sales may decrease and our operating results could suffer.
Our ability to use our net operating loss carryforwards and tax credit carryforwards to offset future taxable income or income tax liabilities for U.S. federal income tax purposes may be subject to limitations, and future transfers of shares of our common stock could cause us to experience an “ownership change” that could limit our ability to utilize our net operating loss carryforward and tax credit carryforwards.
As of December 31, 2021, we had net operating loss carryforwards, or NOLs, of $29.9 million for federal income tax purposes and $11.0 million for state income tax purposes, which may be available to offset our future taxable income, if any. Our federal and state NOLs begin to expire in 2022. Federal NOLs generated in taxable years beginning after December 31, 2017, however will carryforward indefinitely and may generally only be used to
30
offset 80% of taxable income in taxable years beginning after December 31, 2020. As of December 31, 2021, we also had federal and state research and development and other tax credit carryforwards of approximately $1.8 million and $1.6 million, respectively, available to reduce future income tax liabilities. Our federal tax credit carryforwards begin to expire in 2026 and our state tax credits will carryforward indefinitely. These NOLs and tax credit carryforwards could expire unused, to the extent subject to expiration, and be unavailable to offset future taxable income or income tax liabilities.
In addition, in general, under Sections 382 and 383 of the U.S. Internal Revenue Code of 1986, as amended, or the Code, a corporation that undergoes an “ownership change” is subject to limitations on its ability to use its pre-change NOLs and tax credit carryforwards to offset future taxable income and income taxes. For these purposes, an ownership change generally occurs where the aggregate change in stock ownership of one or more stockholders or groups of stockholders owning at least 5% of a corporation’s stock exceeds 50 percentage points over a rolling three-year period. We have completed an ownership change analysis pursuant to IRC Section 382 of the Code through our taxable year ended December 31, 2020, and determined we had undergone an ownership change on June 30, 2017. We do not believe, however, that utilization of any of our pre-June 30, 2017 NOLs or tax credit carryforwards will be limited as a result of such ownership change. We may have experienced ownership changes after December 31, 2020, and we may experience future ownership changes (which may be outside of our control), so our ability to use our NOLs and tax credit carryforwards may nevertheless be limited. For these reasons, we may not be able to use a material portion of our NOLs or tax credit carryforwards, even if we attain profitability. We have recorded a full valuation allowance related to our NOLs and other deferred tax assets due to the uncertainty of the ultimate realization of the future tax benefits of such assets.
If we are unable to implement and maintain effective internal control over financial reporting in the future, the accuracy and timeliness of our financial reporting may be adversely affected. In addition, because of our status as a non-accelerated filer, you will not be able to depend on any attestation from our independent registered public accounting firm as to our internal control over financial reporting for the foreseeable future.
The Sarbanes-Oxley Act of 2002, as amended, or the Sarbanes-Oxley Act, requires, among other things, that we maintain effective disclosure controls and procedures and controls over financial reporting. In particular, we are required to perform system and process evaluations and testing of our internal control over financial reporting to allow management to report on the effectiveness of our internal controls over financial reporting, as required by Section 404 of the Sarbanes-Oxley Act. We are required to furnish a report by management on, among other things, the effectiveness of our internal control over financial reporting beginning for our fiscal year ending December 31, 2017. However, our independent registered public accounting firm will not be required to attest to the effectiveness of our internal control over financial reporting pursuant to Section 404 of the Sarbanes-Oxley Act until the time we are no longer considered a non-accelerated filer. Accordingly, you will not be able to depend on any attestation concerning our internal control over financial reporting from our independent registered public accounting firm for the foreseeable future.
Compliance with environmental matters and worker health and safety laws could be costly, and noncompliance with these laws could have a material adverse effect on our operating results, expenses and financial condition.
Some of our operations use substances regulated under various federal, state, local and international laws governing the environment and worker health and safety, including those governing the discharge of pollutants into the ground, air and water, the management and disposal of hazardous substances and wastes, and the cleanup of contaminated sites. Some of our products are subject to various federal, state, local and international laws governing chemical substances in electronic products. We could be subject to increased costs, fines, civil or criminal sanctions, third-party property damage or personal injury claims if we violate or become liable under environmental and/or worker health and safety laws.
If we are unable to manage our growth and expand our operations successfully, our business and operating results will be harmed, and our reputation may be damaged.
We have expanded our operations significantly in the last several years and anticipate that further significant expansion will be required to achieve our business objectives. The growth and expansion of our business and product offerings places a continuous and significant strain on our management, operational and financial resources. As we transition to a wireless system solutions provider, we expect these challenges to increase. Any such future
31
growth would also add complexity to and require effective coordination throughout our organization. We use the services of third parties to perform tasks including design services and sales and marketing. Our growth strategy may entail expanding our group of contractors or consultants to implement additional functions going forward. Because we rely on consultants, effectively outsourcing key functions of our business, we will need to be able to manage these consultants to ensure that they successfully carry out their contractual obligations and meet expected deadlines. However, if we are unable to effectively manage our outsourced activities or if the quality of the services provided by consultants is compromised for any reason, our ability to provide quality products in a timely manner could be harmed, which may have a material adverse effect on our business operating results and financial condition.
To manage any future growth effectively, we must continue to improve and expand our information technology and financial infrastructure, our operating and administrative systems and controls, and our ability to manage headcount, capital and processes in an efficient manner. We may not be able to successfully implement improvements to these systems and processes in a timely or efficient manner, which could result in additional operating inefficiencies and could cause our costs to increase more than planned. If we do increase our operating expenses in anticipation of the growth of our business and this growth does not meet our expectations, our operating results may be negatively impacted. If we are unable to manage future expansion, our ability to provide high quality products and services could be harmed, which could damage our reputation and brand and may have a material adverse effect on our business, operating results and financial condition.
Our business and prospects depend on the strength of our market efforts and our brand. Failure to maintain and enhance our brand would harm our ability to maintain and expand our base of customers.
Maintaining and enhancing our brand is important to maintaining and expanding our base of customers who purchase our products. This will depend largely on our ability to continue to provide high-quality solutions, and we may not be able to do so effectively. While we may engage in a broader marketing campaign to further promote our brand, this effort may not succeed. Our efforts in developing our brand may be affected by the marketing efforts of our competitors. If we are unable to cost-effectively maintain and increase awareness of our brand, our business, results of operations and financial condition could be harmed. Our brand may be impaired by other factors, including product malfunctions. Any inability to effectively police our trademark rights against unauthorized uses by third parties could adversely impact the value of our trademarks and our brand recognition. If we fail to maintain and enhance our brand, or if we need to incur unanticipated expenses to establish our brand in new markets, our operating results would be negatively affected from reduced sales and increased marketing expenses.
Risks Relating to Intellectual Property
If we are unable to protect our intellectual property rights, our competitive position could be harmed, or we could be required to incur significant expenses to enforce our rights.
Our ability to compete effectively is dependent in part upon our ability to protect our proprietary technology. We rely on patents, trademarks, trade secret laws, confidentiality procedures and licensing arrangements to protect our intellectual property rights. There can be no assurance these protections will be available in all cases or will be adequate to prevent our competitors from copying, reverse engineering or otherwise obtaining and using our technology, proprietary rights or products. For example, the laws of certain countries in which our products are manufactured or licensed do not protect our proprietary rights to the same extent as the laws of the United States. In addition, third parties may seek to challenge, invalidate or circumvent our patents, trademarks, copyrights and trade secrets, or applications for any of the foregoing. There can be no assurance that our competitors will not independently develop technologies that are substantially equivalent or superior to our technology or design around our proprietary rights. In each case, our ability to compete could be significantly impaired. To prevent substantial unauthorized use of our intellectual property rights, it may be necessary to prosecute actions for infringement and/or misappropriation of our proprietary rights against third parties. Any such action could result in significant costs and diversion of our resources and management’s attention, and there can be no assurance we will be successful in such action. Furthermore, many of our current and potential competitors have the ability to dedicate substantially greater resources to enforce their intellectual property rights than we do. Accordingly, despite our efforts, we may not be able to prevent third parties from infringing upon or misappropriating our intellectual property.
32
Claims by others that we infringe their intellectual property rights could harm our business.
Our industry is characterized by vigorous enforcement and pursuit of intellectual property rights, which has resulted in protracted and expensive litigation for many companies. Third parties may in the future assert claims of infringement of intellectual property rights against us or against our customers or channel partners for which we may be liable. As the number of products and competitors in our market increases and overlaps occur, infringement claims may increase.
Intellectual property claims against us, and any resulting lawsuits, may result in our incurring significant expenses and could subject us to significant liability for damages and invalidate what we currently believe are our proprietary rights. Our involvement in any patent dispute or other intellectual property dispute or action to protect trade secrets and know-how could have a material adverse effect on our business. Adverse determinations in any litigation could subject us to significant liabilities to third parties, require us to seek licenses from third parties and prevent us from manufacturing and selling our products. Any of these situations could have a material adverse effect on our business.
These claims, regardless of their merits or outcome, would likely be time consuming and expensive to resolve and could divert management’s time and attention.
We are generally obligated to indemnify our channel partners and end-customers for certain expenses and liabilities resulting from intellectual property infringement claims regarding our products, which could force us to incur substantial costs.
We have agreed, and expect to continue to agree, to indemnify our channel partners and end-customers for certain intellectual property infringement claims regarding our products. As a result, in the case of infringement claims against these channel partners and end-customers, we could be required to indemnify them for losses resulting from such claims or to refund amounts they have paid to us. Our channel partners and other end-customers in the future may seek indemnification from us in connection with infringement claims brought against them. We will evaluate each such request on a case-by-case basis, and we may not succeed in refuting all such claims. If a channel partner or end-customer elects to invest resources in enforcing a claim for indemnification against us, we could incur significant costs disputing it. If we do not succeed in disputing it, we could face substantial liability.
Risks Related to Data Privacy
Because we collect, process, use and store information about individuals, including our customers’ and our own employees, this creates data privacy compliance risks that could result in additional cost and liability to us.
In the normal course of our business, we collect, process, use and disclose information about individuals. Many federal, state and foreign governmental bodies and agencies have adopted, or are considering adopting, laws and regulations that impose limits on the collection, processing, use, disclosure and security of information about individuals. In some cases, such laws and regulations can be enforced by private parties in addition to government entities. In addition, privacy advocacy and industry groups may propose new and different self-regulatory standards that either legally or contractually apply to us. These laws, regulations, and standards are complex and currently evolving, not uniform and likely to remain uncertain for the foreseeable future.
In the United States, data privacy laws and regulations are promulgated at the federal and state level, some of which are enforced by the Federal Trade Commission, or FTC, and federal financial regulatory bodies. For example, the Federal Trade Commission Act grants the FTC authority to enforce against unfair or deceptive practices, which the FTC has interpreted to require companies’ practices with respect to personal information comply with the commitments posted in their privacy policies. There are also laws regulating the use of personal data for direct marketing purposes, including the Controlling the Assault of Non-Solicited Pornography and Marketing Act of 2003, which establishes specific requirements for commercial email messages, and the Telephone Consumer Protection Act, and the Telemarketing Sales Rule as interpreted and implemented by the FCC and United States courts, or TCPA, which imposes significant restrictions on the use of telephone calls and text messages to residential and mobile telephone numbers. At the state level, California recently enacted legislation, the California Consumer Privacy Act of 2018, or CCPA, which provides new data privacy rights for California consumers. Additionally, the California Privacy Rights Act, or CPRA, was approved by California voters in the November 3, 2020, election,
33
taking effect on January 1, 2023, which modifies the CCPA by providing significant new data privacy rights. Additionally, Virginia has adopted a new state data protection act referred to as the Virginia Consumer Data Protection Act, which is set to take effect on January 1, 2023, and Colorado has adopted a new state data protection act titled the Colorado Privacy Act, which is set to take effect on July 1, 2023.
Foreign data protection laws, including the EU General Data Protection Regulation 2016/679, or the GDPR, and the U.K. data protection regime consisting primarily of the UK General Data Protection Regulation and the UK Data Protection Act 2018, or the UK GDPR, may also apply to other personal information obtained outside of the United States. Both the GDPR and the UK GDPR impose stringent requirements for entities processing personal data including specific requirements regarding transfers of data outside of the European Economic Area, or the EEA, and restrictions regarding the use of cookies and other e-marketing activities. Recent legal developments in Europe have created complexity and uncertainty regarding these laws and how to comply.
Although we are continuing to take steps to comply with these and future laws and regulations, the scope of many of the requirements remains unclear, can be subject to significant change or interpretive or enforcement application, and may be inconsistent from one jurisdiction to another, and regulatory guidance on several topics is still forthcoming. Therefore, we cannot assure you that such steps will be sufficient. Compliance with current and future laws and regulations may require changes to our collection, use, transfer, disclosure or other processing of information about individuals and systems, and may thereby increase compliance costs. If we are unsuccessful, whether actual or perceived, in our efforts to comply with these and future laws and regulations, we may incur substantial additional costs in compliance, reputational harm, affect the manner in which we provide our services, including the geographies we service, and be subject to complaints and/or regulatory investigations, significant monetary liability, fines, penalties, regulatory enforcement, individual or class action lawsuits, public criticism, loss of customers, loss of goodwill or other additional liabilities, such as claims by industry groups or other third parties, which may have a material adverse effect on our business, operating results and financial condition.
Risks Related to Our International Operations
Our international sales and operations subject us to additional risks that can adversely affect our operating results and financial condition.
For the year ended December 31, 2021 approximately 47% of our products, based on sales, are outside of North America, and we are continuing to expand our international operations as part of our growth strategy. We have limited sales personnel and sales and support operations in the United States, Asia, and Europe. In addition, following our acquisition of NimbeLink, we anticipate expanding our global presence and extending our salesforce reach internationally. Our ability to convince customers to expand their use of our antenna products is directly correlated to our direct engagement with our end-customers and our channel partners. To the extent we are unable to engage with non-U.S. customers effectively with our limited sales force capacity, we may be unable to grow sales to existing customers.
Our international operations subject us to a variety of risks and challenges, including: increased management, travel, infrastructure and legal compliance costs associated with having multiple international operations; reliance on channel partners; increased financial accounting and reporting burdens and complexities; compliance with foreign laws and regulations; compliance with U.S. laws and regulations for foreign operations; and reduced protection for intellectual property rights in some countries and practical difficulties of enforcing rights abroad. Any of these risks could adversely affect our international operations, reduce our international sales or increase our operating costs, adversely affecting our business, operating results and financial condition and growth prospects.
In addition, we are subject to risks related to regulation of exports, reexports and transfers of products, software or technology regulated under United States laws and regulations. From time to time, the U.S. Department of Commerce may impose licensing restrictions on certain parties with whom we conduct business, which may limit or prohibit our ability to continue these activities. For example, certain of our customers have been or are designated on the U.S. Department of Commerce’s Entity List and subject to licensing requirements in connection with exports, reexports, and transfers of US-regulated items. These designations may result in the loss or temporary loss of such customers and could have a material adverse effect on our business, financial condition and results of operations and affect our international sales strategy in China and elsewhere around the world. Although we undertake to conduct
34
our business in compliance with applicable laws and regulations and have no knowledge of any issues of noncompliance with respect to export controls, our failure to successfully comply therewith may expose us to negative legal and business consequences, including civil or criminal penalties, government investigations, and reputational harm.
We are subject to governmental export and import controls that could impair our ability to compete in international markets due to licensing requirements and subject us to liability if we are not in compliance with applicable laws.
Our products are subject to export control and import laws and regulations, including the U.S. Export Administration Regulations, U.S. Customs regulations and various economic and trade sanctions regulations administered by the U.S. Treasury Department’s Office of Foreign Assets Controls. Exports of our products must be made in compliance with these laws and regulations. If we violate these laws and regulations, we and certain of our employees could be subject to substantial civil or criminal penalties, including the possible loss of export or import privileges, fines, which may be imposed on us and responsible employees or managers, and, in extreme cases, the incarceration of responsible employees or managers. In addition, if our channel partners, agents or consultants fail to obtain appropriate import, export or re-export licenses or authorizations, we may also be adversely affected through reputational harm and penalties. Obtaining the necessary authorizations, including any required license, for a particular sale may be time-consuming, is not guaranteed and may result in the delay or loss of sales opportunities. Changes in our products or changes in applicable export or import laws and regulations may also create delays in the introduction and sale of our products in international markets, prevent our end-customers with international operations from deploying our products or, in some cases, prevent the export or import of our products to certain countries, governments or persons altogether. Any change in export or import laws and regulations, shift in the enforcement or scope of existing laws and regulations, or change in the countries, governments, persons or technologies targeted by such laws and regulations, could also result in decreased use of our products, or in our decreased ability to export or sell our products to existing or potential end-customers with international operations. Any decreased use of our products or limitation on our ability to export or sell our products would likely adversely affect our business, financial condition and operating results.
Furthermore, U.S. export control laws and economic sanctions prohibit the provision of certain products and services to countries, governments, and persons targeted by U.S. sanctions. U.S. sanctions that have been or may be imposed as a result of military conflicts in other countries may impact our ability to sell our products within regions covered by such sanctions. If we fail to comply with export and import regulations and such economic sanctions, penalties could be imposed, including fines and/or denial of certain export privileges. These export and import controls and economic sanctions could also adversely affect our manufacturers, suppliers and customers.
Changes to United States tax, tariff and import/export regulations may have a negative effect on global economic conditions, financial markets and our business.
There have been significant changes and proposed changes to United States trade policies, treaties, tariffs and taxes, including trade policies and tariffs regarding China. For example, the United States has imposed supplemental tariffs of up to 25% on certain imports from China, as well as tariffs on steel and aluminum products imported from various other countries. In response, China and other countries have imposed or proposed additional tariffs on certain exports from the United States. Although we do a significant amount of business in China, including dealing with Chinese suppliers and customers, for the products that use imported components that are covered under these policies, our import of components for manufacture of products in the U.S is subject to relatively lower tariff rates and therefore we do not expect these tariffs to have a material impact on us. Additionally, in 2020 we contracted with a new contract manufacturer outside of China, which gives us additional supply chain diversity as well as an option of supply of components and assemblies for our products that can be imported to the United States without the supplemental tariff. However, these and other proposed policy changes have created significant uncertainty about the future relationship between the United States and China, as well as other countries, including with respect to the trade policies, treaties, government regulations and tariffs that could apply to trade with those countries. These developments, or the perception that any of them could occur, may have a material adverse effect on global economic conditions and the stability of global financial markets, and may significantly reduce global trade and, in particular, trade between these countries and the United States. Any of these factors could depress economic activity and restrict our access to suppliers or customers and have a material adverse effect on our business, financial condition and results of operations and affect our strategy in China and elsewhere around the world.
35
New regulations or standards or changes in existing regulations or standards in the United States or internationally related to our products or our end-customer’s products may result in unanticipated costs or liabilities, which could have a material adverse effect on our business, operating results and future sales, and could place additional burdens on the operations of our business.
Our end-customers’ products are subject to governmental regulations regarding radio frequency devices in many jurisdictions. To achieve and maintain market acceptance, our end-customers’ products must continue to comply with these regulations and many industry standards designed to prevent interference with other radio services and to limit human exposure to harmful radiation. In the United States, our end-customers’ products must comply with such regulations issued by the Federal Communications Commission before they can be marketed or sold, or imported into, the United States, and may also be required to conform to industry standards defined by industry associations or organizations, such as Underwriters Laboratories, for commercial acceptance. Our end-customers must also comply with similar international regulations and standards.
As these regulations and standards evolve, and if new regulations or standards are implemented, we may have to modify or redesign our products or our end-customers may have to modify their products, which could increase costs. The failure of our products or their products to comply, or cause delays in compliance, with the existing and evolving industry regulations and standards could prevent or delay introduction of our products or our antennas used in their products, which could harm our business. End-customer uncertainty regarding future policies may also affect demand for communications products, including our products. Moreover, channel partners or customers may require us, or we may otherwise deem it necessary or advisable, to alter our products to address actual or anticipated changes in the regulatory environment. Our inability to alter our products to address these requirements and any regulatory changes may have a material adverse effect on our business, operating results and financial condition.
We could be adversely affected by violations of the U.S. Foreign Corrupt Practices Act and similar worldwide anti-bribery laws.
We operate in directly and indirectly in several foreign countries. The U.S. Foreign Corrupt Practices Act, or FCPA, and similar anti-bribery laws generally prohibit companies and their intermediaries from making improper payments to foreign government officials for the purpose of obtaining or retaining business or an unfair business advantage; many anti-bribery laws also prohibit commercial bribery. Practices in the local business communities of many countries in which we do business have a heightened level of corruption. In addition, we are subject to the FCPA's recordkeeping and internal controls requirements. Our policies mandate compliance with these anti-bribery laws and we have established policies and procedures designed to promote compliance with these anti-bribery law requirements; however, we cannot assure that our policies and procedures will protect us from violations committed by individual employees or agents. Allegations or violations of anti-bribery law violations could result in costly investigations, criminal or civil penalties or other sanctions that could have a material adverse effect on our business and reputation.
Risks Related to Our Common Stock
The price of our common stock may be volatile.
The trading price of our common stock may be volatile and may fluctuate substantially in response to various factors. This may be especially true for companies with a small public float. As a result of this volatility, investors may not be able to sell their common stock at or above the price at which they paid. The trading price of our common stock depends on several factors, including those described in this “Risk Factors” section and elsewhere in this annual report, including:
36
In addition, the stock market in general, and the market for technology companies in particular, have experienced extreme price and volume fluctuations that have often been unrelated or disproportionate to the operating performance of those companies. Broad market and industry factors, as well as general economic, political and market conditions such as recessions or interest rate changes, may seriously affect the market price of our common stock, regardless of our actual operating performance. The realization of any of the above risks or any of a broad range of other risks, including those described in this “Risk Factors” section and elsewhere in this annual report on Form 10-K could have a dramatic and material adverse impact on the market price for our common stock.
In addition, in the past, following periods of volatility in the overall market and the market prices of particular companies’ securities, securities class action litigations have often been instituted against these companies. Litigation of this type, if instituted against us, could result in substantial costs and a diversion of our management’s attention and resources. Any adverse determination in any such litigation or any amounts paid to settle any such actual or threatened litigation could require that we make significant payments.
If securities or industry analysts issue an adverse opinion regarding our stock our stock price and trading volume could decline.
The trading market for our common stock is influenced by the research and reports that securities or industry analysts may publish about us, our business, our market or our competitors. We currently have limited research coverage by securities and industry analysts. If any of the analysts who may cover us change their recommendation regarding our common stock adversely, or provide more favorable relative recommendations about our competitors, the trading price of our common stock would likely decline. If any analyst who may cover us were to cease coverage
37
of our company or fail to regularly publish reports on us, we could lose visibility in the financial markets, which in turn could cause the trading price of our common stock or trading volume to decline.
Anti-takeover provisions in our charter documents and under Delaware law could make an acquisition of us, which may be beneficial to our stockholders, more difficult and may prevent attempts by our stockholders to replace or remove our current management and limit the market price of our common stock.
Provisions in our amended and restated certificate of incorporation and amended and restated bylaws may have the effect of delaying or preventing a change of control or changes in our management. Some of these provisions:
In addition, we are subject to the provisions of Section 203 of the Delaware General Corporation Law, which limits the ability of stockholders owning in excess of 15% of our outstanding voting stock to merge or combine with us. Furthermore, our amended and restated certificate of incorporation specifies that, unless we consent in writing to the selection of an alternative forum, the Court of Chancery of the State of Delaware will be the sole and exclusive forum for most legal actions involving actions brought against us by stockholders. We believe this provision benefits us by providing increased consistency in the application of Delaware law by chancellors particularly experienced in resolving corporate disputes, efficient administration of cases on a more expedited schedule relative to other forums and protection against the burdens of multi-forum litigation. However, the provision may have the effect of discouraging lawsuits against our directors and officers. The enforceability of similar choice of forum provisions in other companies’ certificates of incorporation has been challenged in legal proceedings, and it is possible that, in connection with any applicable action brought against us, a court could find the choice of forum provisions contained in our amended and restated certificate of incorporation to be inapplicable or unenforceable in such action.
These anti-takeover provisions and other provisions in our amended and restated certificate of incorporation and amended and restated bylaws could make it more difficult for stockholders or potential acquirers to obtain control of our board of directors or initiate actions that are opposed by the then-current board of directors and could also delay or impede a merger, tender offer or proxy contest involving our company. These provisions could also discourage proxy contests and make it more difficult for you and other stockholders to elect directors of your choosing or cause us to take other corporate actions you desire. Any delay or prevention of a change of control transaction or changes in our board of directors could cause the market price of our common stock to decline.
We have never paid cash dividends on our common stock, and we do not anticipate paying cash dividends in the foreseeable future.
We have never declared or paid any cash dividends on our common stock and do not intend to pay any cash dividends in the foreseeable future. We currently intend to retain any future earnings to fund the growth of our business. Any determination to pay dividends in the future will be at the discretion of our board of directors and will depend on our financial condition, operating results, capital requirements, general business conditions and other
38
factors that our board of directors may deem relevant and subject to the restrictions contained in any loan or financing instruments. Our present loan and security agreement with Silicon Valley Bank restricts us from paying dividends. As a result, capital appreciation, if any, of our common stock will be the sole source of gain for the foreseeable future.
Our inability to raise additional capital on acceptable terms in the future may limit our ability to develop and commercialize new solutions and technologies and expand our operations.
If our available cash balances and anticipated cash flow from operations are insufficient to satisfy our liquidity requirements, including because of lower demand for our products as a result of other risks described in this “Risk Factors” section and elsewhere in this annual report, we may seek to raise additional capital through equity offerings, debt financings, collaborations or licensing arrangements. We may also consider raising additional capital in the future to expand our business, pursue strategic investments, take advantage of financing opportunities, or other reasons.
Additional funding may not be available to us on acceptable terms, or at all. If we raise funds by issuing equity securities, dilution to our stockholders could result. Any equity securities issued also may provide for rights, preferences or privileges senior to those of holders of our common stock. The terms of debt securities issued, or borrowings could impose significant restrictions on our operations. The incurrence of indebtedness or the issuance of certain equity securities could result in increased fixed payment obligations and could also result in restrictive covenants, such as limitations on our ability to incur additional debt or issue additional equity, limitations on our ability to acquire or license intellectual property rights, and other operating restrictions that could adversely affect our ability to conduct our business. In addition, the issuance of additional equity securities by us, or the possibility of such issuance, may cause the market price of our common stock to decline. The global credit and financial markets have recently experienced extreme volatility and disruptions (including as a result of the ongoing COVID-19 pandemic and the military conflict between Russia and Ukraine). If the current equity and credit markets remain volatile or continue to deteriorate, it may make any necessary debt or equity financing more difficult to obtain, more costly and more dilutive. If we do not have, or are not able to obtain, sufficient funds, we may have to delay development or commercialization of our products or license to third parties the rights to commercialize products or technologies that we would otherwise seek to commercialize. If we raise additional funds through collaboration and licensing arrangements with third parties, it may be necessary to relinquish some rights to our technologies or our products, or to grant licenses on terms that are not favorable to us. If we are unable to raise adequate funds, we may have to liquidate some or all of our assets, or delay, reduce the scope of or eliminate some or all of our development programs. We also may have to reduce marketing; customer support or other resources devoted to our products or cease operations. Any of these actions could harm our business, operating results and financial condition.
We are a “smaller reporting company,” and if we take advantage of certain exemptions from disclosure requirements available to smaller reporting companies, this could make our stock less attractive to investors and may make it more difficult to compare our performance with other public companies.
We are a “smaller reporting company” as defined in Item 10(f)(1) of Regulation S-K. Smaller reporting companies may take advantage of certain reduced disclosure obligations, including, among other things, reduced executive compensation disclosures and providing only two years of audited financial statements. We will remain a smaller reporting company until the last day of the fiscal year in which (1) the market value of our common stock held by non-affiliates equals or exceeds $250 million as of the prior June 30, or (2) our annual revenue equals or exceeds $100 million during such completed fiscal year and the market value of our common stock held by non-affiliates equals or exceeds $700 million as of the prior June 30. To the extent we take advantage of such reduced disclosure obligations, our stockholders may not have access to certain information they may deem important. It may also make comparison of our financial statements with other public companies difficult or impossible. If investors find our common stock less attractive as a result of our reliance on these exemptions, the trading prices of our common stock may be lower than they otherwise would be, there may be a less active trading market for our common stock and the trading prices of our common stock may be more volatile.
39
We incur significant costs as a result of operating as a public company, and our management is required to devote substantial time to comply with the laws and regulations affecting public companies, particularly after we are no longer a smaller reporting company or a non-accelerated filer.
As a public company, particularly after we cease to qualify as a smaller reporting company or non-accelerated filer, we incur significant legal, accounting and other expenses that we did not incur as a private company, including costs associated with public company reporting and corporate governance requirements, to comply with the rules and regulations imposed by the Sarbanes-Oxley Act and the Dodd-Frank Act, as well as rules implemented by the SEC and Nasdaq. Our management and other personnel need to devote a substantial amount of time to these compliance initiatives and our legal and accounting compliance costs will increase. It is likely that we will need to hire additional staff in the areas of investor relations, legal and accounting. These new rules and regulations may make it more difficult and expensive for us to obtain director and officer liability insurance, and we may be required to accept reduced policy limits and coverage or incur substantially higher costs to obtain the same or similar coverage. As a result, it may be more difficult for us to attract and retain qualified individuals to serve on our board of directors or as executive officers. We are evaluating and monitoring developments regarding these rules, and we cannot predict or estimate the amount of additional costs we may incur or the timing of such costs.
For example, the Sarbanes-Oxley Act requires, among other things, that we maintain effective internal controls over financial reporting and disclosure controls and procedures. In particular, as a public company, we are required to perform system and process evaluations and testing of our internal control over financial reporting to allow management to report on the effectiveness of our internal controls over financial reporting, as required by Section 404 of the Sarbanes-Oxley Act. As described above, as long as we are considered a non-accelerated filer, we will not need to comply with the auditor attestation provisions of Section 404. Our testing, or the subsequent testing by our independent registered public accounting firm, may reveal deficiencies in our internal control over financial reporting that are deemed to be material weaknesses. Our compliance with Section 404 will require that we incur substantial accounting expense and management time on compliance-related issues. Moreover, if we are not able to comply with the requirements of Section 404 in a timely manner, or if we or our independent registered public accounting firm identify deficiencies in our internal control over financial reporting that are deemed to be material weaknesses, we could lose investor confidence in the accuracy and completeness of our financial reports, which could cause our stock price to decline.
Until December 31, 2021, we qualified for further exemptions and reduced disclosure requirements as an “emerging growth company,” as defined in the JOBS Act. Since we are no longer an emerging growth company, we will no longer be exempt from certain requirements, including, without limitation, holding non-binding stockholder votes on executive compensation arrangements and compliance with new or revised accounting standards and audit requirements. We expect to incur additional expenses and devote increased management effort toward ensuring compliance with these requirements, as well as when the available exemptions for a smaller reporting company or a non-accelerated filer are no longer available to us. We cannot predict or estimate the amount of additional costs we may incur as a result of becoming a public company or the timing of such costs.
General Risk Factors
Litigation or legal proceedings could expose us to significant liabilities and damage our reputation.
We may become party to litigation claims and legal proceedings. Litigation involves significant risks, uncertainties and costs, including distraction of management attention away from our current business operations. We evaluate litigation claims and legal proceedings to assess the likelihood of unfavorable outcomes and to estimate, if possible, the amount of potential losses. We caution you that actual outcomes or losses may differ materially from those envisioned by our current estimates. Our policies and procedures require strict compliance by our employees and agents with all United States and local laws and regulations applicable to our business operations, including those prohibiting improper payments to government officials. Nonetheless, there can be no assurance that our policies and procedures will always ensure full compliance by our employees and agents with all applicable legal requirements. Improper conduct by our employees or agents could damage our reputation in the United States and internationally or lead to litigation or legal proceedings that could result in civil or criminal penalties, including substantial monetary fines, as well as disgorgement of profits.
40
A failure in our information technology systems could negatively impact our business.
We rely on information technology to process, transmit, and store electronic and financial information and information about individuals, to manage a variety of business processes and activities, to maintain the financial accuracy of our records, and to comply with regulatory, legal and tax requirements. We also depend on our information technology infrastructure for digital marketing and sales activities and for electronic communications among our locations, personnel, customers, and suppliers around the world. Many of the information technology systems used by us globally have been in place for many years and not all hardware and software is currently supported by vendors. These information technology systems are susceptible to damage, disruptions, or shutdowns due to failures during the process of upgrading or replacing software, databases or components thereof, power outages, hardware failures, computer viruses, cyber-attacks, telecommunication failures, defects, errors, catastrophic events, terrorism or war, such as the conflict between Russia and Ukraine. If our information technology systems suffer severe damage, disruption, or shutdown and our business continuity plans do not effectively resolve the issues in a timely manner, our product sales, financial condition, and results of operations may be materially affected, and we could experience delays in reporting our financial results.
Information technology security threats are increasing in frequency, persistence, intensity and sophistication. We may also experience information technology security threats that may remain undetected for an extended period. Any perceived or actual compromise, breach, or misuse of our systems or information could cause us to incur damage to our reputation, and expose us to a risk of loss or litigation (including by our customers) and possible monetary liability, affect the manner in which we provide our services, and subject us to complaints and/or regulatory investigations, fines, penalties, regulatory enforcement, individual or class action lawsuits, public criticism, loss of customers, loss of goodwill or other additional liabilities, and could adversely affect our business, results of operations, financial condition and prospects. We may also incur significant costs to notify, in particular, affected individuals, maintain our security precautions and/or to correct problems caused by the compromise, breach or misuse of our systems or information. The costs of any compromise, breach or misuse of our systems or information could exceed our available insurance coverage, or could result in denial of coverage as to any specific claim, or a change or cessation in our insurance policies and coverages, including premium increases or the imposition of large deductible requirements. To date, we have seen no material impact on our business or operations from these information technology security threats. Any future significant compromise, breach, or misuse of our data security could result in significant costs and damage to our reputation. The ever-evolving threats mean us, and our third-party service providers must continually evaluate and adapt our respective systems and processes and overall security environment, as well as those of any companies we acquire. There is no guarantee that these measures will be adequate to safeguard against all data security compromises, breaches, or misuses.
Our business is subject to the risks of earthquakes, fire, floods and other natural catastrophic events.
Our corporate headquarters are located in Southern California, and our two contract manufacturers are located in eastern Asia, both regions known for seismic activity. A significant natural disaster, such as an earthquake, a fire or a flood, occurring near our headquarters, or near the facilities of our contract manufacturers, could have a material adverse impact on our business, operating results and financial condition.
Changes in tax law may materially adversely affect our financial condition, results of operations and cash flows.
New income, sales, use or other tax laws, statutes, rules, regulations or ordinances could be enacted at any time, or interpreted, changed, modified or applied adversely to us, any of which could adversely affect our business operations and financial performance. In particular, the U.S. government may enact significant changes to the taxation of business entities including, among others, an increase in the corporate income tax rate and the imposition of minimum taxes or surtaxes on certain types of income. The likelihood of these changes being enacted or implemented is unclear. We are currently unable to predict whether such changes will occur. If such changes are enacted or implemented, we are currently unable to predict the ultimate impact on our business. We urge our investors to consult with their legal and tax advisors with respect to any changes in tax law and the potential tax consequences of investing in our common stock.
41
Our business, operating results and growth rates may be adversely affected by current or future unfavorable economic and market conditions.
Our business depends on the economic health and general willingness of our current and prospective end- customers to make those capital commitments necessary to purchase our products. If the conditions in the U.S. and global economies remain uncertain or continue to be volatile, or if they deteriorate, including as a result of the current or anticipated impact of military conflict, such as the conflict between Russia and Ukraine, terrorism or other geopolitical events, our business, operating results and financial condition may be materially adversely affected. Economic weakness, end-customer financial difficulties, limited availability of credit and constrained capital spending have at times in the past resulted, and may in the future result, in challenging and delayed sales cycles, slower adoption of new technologies and increased price competition, and could negatively affect our ability to forecast future periods, which could result in an inability to satisfy demand for our products and a loss of market share.
In addition, if interest rates rise or foreign exchange rates weaken for our international customers, overall demand for our products and services could decline and related capital spending may be reduced. Furthermore, any increase in worldwide commodity prices may result in higher component prices for us and increased shipping costs, both of which may negatively affect our business, operating results and financial condition.
42
ITEM 1B. UNRESOLVED STAFF COMMENTS
None.
ITEM 2. PROPERTIES
Our corporate headquarters occupy approximately 10,700 square feet in San Diego, California, under a lease that expires in November 2025. Our Scottsdale, Arizona facility occupies 10,300 square feet under a lease that expires in April 2022. Our NimbeLink facility, located in Plymouth, Minnesota, occupies 9,000 square feet under a lease that expires in July 2025. We lease two facilities, a 2,100 square foot facility in Scottsdale, Arizona and a 2,500 square foot facility in Riverview, Florida which are used for research and development activities. We also lease a 4,300 square foot property in Rancho Santa Fe, California and a 3,000 square foot property in Melbourne, Florida, both of which are used for testing services.
We lease an office space in four locations outside of the United States including leases in Shenzhen, China, Jiangsu Province, China, Shulin City, Taiwan, and Cambridge, United Kingdom.
We believe our facilities are suitable and sufficient to meet our current operating needs.
ITEM 3. LEGAL PROCEEDINGS
From time to time, we may be a party to legal proceedings and subject to claims incident in the ordinary course of business. Although the results of litigation and claims cannot be predicted with certainty, we believe that the final outcome of these matters will not have a material adverse effect on our financial condition or business. Regardless of the outcome, litigation can have an adverse impact on us because of defense and settlement costs, diversion of management resources, and other factors.
ITEM 4. MINE SAFETY DISCLOSURES
Not applicable.
43
PART II
ITEM 5. MARKET FOR REGISTRANT’S COMMON EQUITY, RELATED STOCKHOLDER MATTERS AND ISSUER PURCHASES OF EQUITY SECURITIES
Market Information
Our common stock is listed on the Nasdaq Capital Market under the symbol “AIRG”.
Holders of Common Stock
As of March 18, 2022, there were 10,187,488 shares of our common stock outstanding held by approximately 34 holders of record of our common stock. This number was derived from our shareholder records and does not include beneficial owners of our common stock whose shares are held in the name of various dealers, clearing agencies, banks, brokers and other fiduciaries.
Dividend Policy
We have never declared or paid cash dividends on our common stock. We currently intend to retain all available funds and any future earnings for use in the operation of our business and do not anticipate paying any cash dividends on our common stock in the foreseeable future. Any future determination to declare dividends will be made at the discretion of our board of directors and will depend on our financial condition, operating results, capital requirements, general business conditions and other factors that our board of directors may deem relevant and subject to the restrictions contained in any loan or financing instruments. Our present loan and security agreement with Silicon Valley Bank restricts us from paying dividends.
Equity Compensation Plan Information
See Part III, Item 12, “Security Ownership of Certain Beneficial Owners and Management and Related Stockholder Matters” for information regarding securities authorized for issuance under equity compensation plans.
Unregistered Sales of Equity Securities
None.
Issuer Repurchases of Equity Securities
None.
ITEM 6. [Reserved]
44
ITEM 7. MANAGEMENT’S DISCUSSION AND ANALYSIS OF FINANCIAL CONDITION AND RESULTS OF OPERATIONS
You should read the following discussion and analysis of our financial condition and operating results together with our financial statements and related notes included elsewhere in this annual report. This discussion and analysis contains forward-looking statements based upon current beliefs, plans and expectations that involve risks, uncertainties and assumptions. Our actual results may differ materially from those anticipated in these forward-looking statements as a result of various factors, including those set forth under “Risk Factors” or in other parts of this annual report. Unless expressly stated otherwise, for discussion and analysis of results for the year ended December 31, 2020 and the comparison of 2020 and 2019 results, please refer to Item 7 of Part II, “Management’s Discussion and Analysis of Financial Condition and Results of Operations” in our Annual Report on Form 10-K for the year ended December 31, 2020, which was filed with the United States Securities and Exchange Commission on February 19, 2021 and is incorporated herein by reference.
Business Overview
We are a leading provider of advanced wireless connectivity solutions and technologies used to enable high performance wireless networking across a broad and increasing range of devices and markets, including consumer, enterprise and automotive. Our mission is to connect the world through advanced antenna systems and integrated wireless solutions. Our innovative antenna systems are designed to address key challenges with wireless system performance faced by our customers. We provide solutions to complex RF, engineering challenges to help improve wireless services that require higher throughput, broad coverage footprint, and carrier grade quality.
We are transitioning from a passive antenna and related services provider to a wireless system solutions provider, targeting higher levels of integration and complexity, and therefore, higher selling prices and margins and in 2020 we announced our new patented AirgainConnect® platform. The first product from this platform is the FirstNet Ready AirgainConnect AC-HPUE antenna-modem, targeting vehicles used by first responders. The AC-HPUE antenna-modem includes an integrated high-power LTE modem supporting the 3GPP Band 14 HPUE (or high-power user equipment) output power functionality and is certified to run on the AT&T FirstNet network.
On January 7, 2021 we purchased 100% of the outstanding shares of Minnesota-based NimbeLink Corp., an IIoT company focused on the design, development, and delivery of cellular solutions for enterprise customers. NimbeLink provides carrier-certified embedded modems and asset tracking solutions that minimize or often eliminate RF design and certification time from project schedules, significantly reducing costs and time to market. The acquisition of NimbeLink supports our transition toward becoming a more system-level company and will play an important role in our overall growth strategy to broaden market diversification, especially within the IIoT space. NimbeLink’s IIoT expertise puts them squarely in one of our targeted enterprise submarkets and extends the breadth and opportunity for our AirgainConnect platform. Our worldwide salesforce represents a present opportunity to expand NimbeLink’s reach and NimbeLink will now gain access to design opportunities they were not previously able to win. The result is an increase in the opportunities for Airgain in the enterprise market and a more diverse offering of products and expertise for our customers.
The consumer market encompasses a large and growing market of consumers using wireless-enabled devices and our antennas are deployed in consumer access points, wireless gateways, Wi-Fi Mesh systems and extenders, smart TVs, smart home devices, and set-top boxes. Our Antennas support an array of technologies, including WLAN, Wi-Fi, LTE, 5G and LPWAN.
The enterprise market is characterized by devices that provide reliable wireless access for high-density environments such as buildings, campuses, transportation terminals and stadiums. Within this market our antennas are deployed across a wide range of systems, devices, and applications that include access points and gateways, fixed wireless access infrastructure, small cells, and remote radio heads. Our products are well positioned to increase our growth in this market.
In the automotive market, our antennas are deployed in a wide range of vehicles to support a variety of wireless connectivity solutions in the fleet and aftermarket segment and support a variety of technologies that include WiFi, 3G, LTE, Satellite and LPWAN. The fleet and aftermarket segment of the automotive market consists
45
of applications whereby rugged vehicular wireless routers are paired with external antenna systems to provide connectivity to fixed and mobile assets. Within the fleet and aftermarket market segment, there has been a rise in the number of antennas per vehicle. The majority of our revenues are currently derived from fleet and aftermarket sales and going forward, our strategy is to augment our current sales in the automotive aftermarket with design wins and sales into the automotive OEMs.
Our design teams partner with customers from the early stages of antenna prototyping to device throughput testing to facilitate optimal performance and quick time to market. Our capabilities include design, custom engineering support, integration, and OTA testing. These capabilities have resulted in a strong reputation across the OEM, ODM and chipset manufacturer ecosystem. Our competencies and strengths have helped us secure design wins used in multiple reference designs from leading Wi-Fi chipset vendors, OEMs, ODMs, chipset manufacturers and service providers rely on these reference designs and our engineering skills to deliver superior throughput performance. We view our relationship with OEM, ODM, chipset manufacturers and service providers as an important attribute to our long-term strategy and success.
We believe demand is growing rapidly for our advanced wireless connectivity solutions and technologies and there is a significant market opportunity. As the ability to provide mobile internet access grows, our solutions and expertise become more important to prospects and customers. As a passive component, embedded antennas can be viewed as a commodity. However, our design, engineering, and research show that antenna selection, placement, and testing can have significant improvements in device performance. We believe that we are chosen when performance is a more significant factor than price, and our distinctive focus on superior designs that provide increased range and throughput has allowed us to build a leadership position in the in-home WLAN device market.
Our financial highlights for 2021 include the following:
We believe that our performance and future success depend upon several factors including continuing effects of COVID-19 on our customer product rollouts, continuation of the global supply shortages, the growth in sales of AirgainConnect AC-HPUE and related products, transitions to contract manufacturers and success in integrating NimbeLink and increasing its sales. Our performance and future success also depend on historical factors such as manufacturing costs, continued investments in our growth, our ability to expand into growing addressable markets, including consumer, enterprise, and automotive, the average selling prices of our products per device, the number of antennas per device, and our ability to diversify the number of devices that incorporate our antenna products. Our customers are price conscious, and our operating results are affected by pricing pressure which may force us to lower prices below our established list prices. In addition, a few end-customer devices which incorporate our antenna products comprise a significant amount of our sales, and the discontinuation or modification of such devices may materially and adversely affect our sales and results of operations. Our ability to maintain or increase our sales depends on, among other things, new and existing end-customers selecting our antenna solutions for their wireless
46
devices and networks, the impact of the COVID-19 pandemic, as discussed above, the deployment level of AirgainConnect AC-HPUE, the proliferation of Wi-Fi connected home devices and data intensive applications, trends related to in-house design in our traditional set top market, investments in our growth to address customer needs, the impact of the global supply shortage on our business and that of our end customers, our ability to target new end markets, development of our product offerings and technology solutions, and international expansion, as well as our ability to successfully integrate past and any future acquisitions. While each of these areas presents significant opportunities for us, they also pose significant risks and challenges we must successfully address. We discuss many of these risks, uncertainties and other factors in this annual report in greater detail under the section entitled “Risk Factors.”
COVID-19 Pandemic
The United States and other countries around the world are experiencing a major health pandemic related to COVID-19, which has created considerable instability and disruption in the U.S. and world economies. Governmental authorities in impacted regions have taken actions in an effort to slow the spread of COVID-19’s spread, resulting in limitations on business operations and consumer and employee travel. We have worked, and continue to work, to comply within the framework of local, county, state, and federal laws. In that regard, we have implemented a wide range of practices to protect and support our employees and to modify and monitor the engagement with our customers, suppliers, and contract manufacturers. Specifically, in response to continuing efforts to contain the spread of COVID-19 as new strains emerge, we have continued to monitor or modify our workspaces and facilities to continue to operate at full function yet with precautions in place to help prevent outbreak or spread of the virus. In the United States, we continue to manage the number of our employees present in the San Diego office and those who are working from home, in a manner to maximize operational capacity yet still limit any spread or outbreaks of the virus. In accordance with local regulations, engineering, testing and production operations in our Scottsdale offices, as well as testing operations in our remote facilities, have resumed with protocols in place to help prevent and limit the spread of the virus. In each work location, protocols have been established and remain in place, in accordance with government guidance, in order to minimize the risk to those employees whose presence in the office is necessary or allowed. Our salespeople have recommenced some business travel but also continue to engage with customers remotely rather than in person to secure sales of, and opportunities for, our products and services.
The continued spread of COVID-19 and its related effects on our business have had a material and adverse effect on our business operations. Through the date of this filing, these disruptions or restrictions include restrictions on our ability to travel, temporary closures of our office buildings or the facilities of our customers or suppliers, and during 2021 disruptions with certain components in our supply chain located in Asia as well as those of our customers. Such disruptions to our customers have had a negative impact on our sales and operating results throughout 2021. Related to sales, we saw orders reach historic lows for our previously core consumer business in the fourth quarter. We have seen signs that the consumer business is beginning to rebound, however, the continued spread of COVID-19 may adversely affect such rebound and have a negative effect on our operating results in future quarters.
The impact of the COVID-19 pandemic on the U.S. and world economies generally, and our future results in particular, could be significant and will largely depend on future developments, which are highly uncertain and cannot be predicted.
Seasonality
Our operating results historically have not been subject to significant seasonal variations. However, our operating results are affected by how customers make purchasing decisions around local holidays in China. For example, a national holiday the first week of October in China may cause customers to purchase product in the third quarter ahead of their holiday season to account for higher volume requirements in the fourth quarter. In addition, although it is difficult to make broad generalizations, our sales tend to be lower in the first quarter of each year compared to other quarters due to the Chinese New Year. The broader economic impacts caused by the COVID-19 pandemic in China may also contribute to the traditionally slower first quarter sales this year. Results for any quarter may not be indicative of the results that may be achieved for the full fiscal year and these patterns may change as a result of general customer demand or product cycles.
47
Key Components of Our Results of Operations and Financial Condition
Sales
We primarily generate revenue from the sales of our products. As discussed further in “Critical Accounting Policies and Significant Judgments and Estimates” below, we recognize revenue to depict the transfer of control over promised goods or services to customers in an amount that reflects the consideration to which the entity expects to be entitled for those goods or services. We generally recognize product sales at the time of shipment to our customers, provided that all other revenue recognition criteria have been met. Although currently insignificant, we also generate service revenue from agreements to provide design, engineering, and testing services as well as subscription revenue from the sale of data plans.
Cost of Goods Sold
The cost of goods sold reflects the cost of producing antenna, embedded modem and asset tracking products that are shipped for our customers’ devices as well as costs incurred for service agreements. This primarily includes manufacturing costs of our products payable to our third-party contract manufacturers, as well as manufacturing costs incurred at our facility in Arizona. The cost of goods sold that we generate from services provided to customers primarily includes personnel costs and the cost to maintain data lines.
Operating Expenses
Our operating expenses are classified into four categories: research and development, sales and marketing, general and administrative and the change in fair value of contingent consideration . For the first three categories, the largest component is personnel costs, which includes salaries, employee benefit costs, bonuses, and stock-based compensation. Operating expenses also include allocated overhead costs for depreciation of equipment, facilities and information technology. Allocated costs for facilities consist of leasehold improvements and rent. Operating expenses are generally recognized as incurred.
Research and Development. Research and development expenses primarily consist of personnel and facility-related costs attributable to our engineering research and development personnel. These expenses include work related to the design, engineering and testing of antenna and modem designs and antenna integration, validation and testing of customer devices. These expenses include salaries, including stock-based compensation, benefits, bonuses, travel, communications, and similar costs, and depreciation and allocated costs for certain facilities. We may also incur expenses from consultants and for prototyping new antenna solutions. We expect research and development expenses to increase in absolute dollars in future periods as we continue to invest in the development of new solutions and markets and as we invest in improving efficiencies within our supply chain, although our research and development expense may fluctuate as a percentage of total sales.
Sales and Marketing. Sales and marketing expenses primarily consist of personnel and facility-related costs for our sales, marketing, and business development personnel, stock-based compensation and bonuses earned by our sales personnel, and commissions earned by our third-party sales representative firms. Sales and marketing expenses also includes the costs of trade shows, marketing programs, promotional materials, demonstration equipment, travel, recruiting, and allocated costs for certain facilities. We expect sales and marketing expenses to fluctuate as a percentage of total sales.
General and Administrative. General and administrative expenses primarily consist of personnel and facility- related costs for our executive, finance, and administrative personnel, including stock-based compensation, as well as legal, accounting, and other professional services fees, depreciation, and other corporate expenses. We expect general and administrative expenses to fluctuate as we grow our operations.
Change in Fair Value of Contingent Consideration. The fair value of contingent consideration associated with the NimbeLink acquisition is remeasured at each reporting period based on the forecasted revenue targets. The change in the fair value of contingent consideration is recorded to operating expenses. See Note 4 of the Notes to the Consolidated Financial Statements contained within this annual report for further information.
48
Other Expense (Income)
Interest Income, net. Interest income consists of interest from our cash and cash equivalents offset by interest expense which consists of interest charges on credit card charges and certain vendor bills.
Other Expense. Other expense consists of the loss from disposal of property and equipment, realized foreign exchange gains or losses, and other expenses.
Provision for Income Taxes
Provision for income taxes consists of federal and state income taxes. In assessing the realizability of deferred tax assets, management considers whether it is more likely than not that some portion or all of the deferred tax assets will not be realized. The ultimate realization of deferred tax assets is dependent upon the generation of future taxable income during the periods in which those temporary differences become deductible. Management considers the scheduled reversal of deferred tax liabilities (including the impact of available carryback and carryforward periods), projected future taxable income, and tax-planning strategies in making this assessment. It is difficult for us to project future taxable income as the timing and size of sales of our products are variable and difficult to predict. We concluded that it is not more likely than not that we will utilize our deferred tax assets other than those that are offset by reversing temporary differences.
Results of Operations
The following tables set forth our operating results for the periods presented as a percentage of our total sales for those periods. The period-to-period comparison of financial results is not necessarily indicative of financial results to be achieved in future periods.
|
For the Years Ended December 31, |
|
|||||
|
2021 |
|
|
2020 |
|
||
Statements of Operations Data: |
|
|
|
|
|
||
Sales |
|
100.0 |
% |
|
|
100.0 |
% |
Cost of goods sold |
|
61.7 |
|
|
|
53.4 |
|
Gross profit |
|
38.3 |
|
|
|
46.6 |
|
Operating expenses: |
|
|
|
|
|
||
Research and development |
|
17.0 |
|
|
|
18.8 |
|
Sales and marketing |
|
15.9 |
|
|
|
12.7 |
|
General and administrative |
|
21.1 |
|
|
|
21.6 |
|
Change in fair value of contingent consideration |
|
3.2 |
|
|
|
— |
|
Total operating expenses |
|
57.1 |
|
|
|
53.1 |
|
Loss from operations |
|
(18.9 |
) |
|
|
(6.5 |
) |
Other expense (income) |
|
0.0 |
|
|
|
0.4 |
|
Loss before income taxes |
|
(18.9 |
) |
|
|
(6.1 |
) |
Provision for income taxes |
|
(3.2 |
) |
|
|
0.6 |
|
Net loss |
|
(15.7 |
)% |
|
|
(6.7 |
)% |
Comparison of the Years Ended December 31, 2021 and 2020
(all tables—dollars in thousands)
Sales
|
|
For the Years Ended December 31, |
|
|||||||||||||
|
|
2021 |
|
|
2020 |
|
|
$ Change |
|
|
% Change |
|
||||
Sales |
|
$ |
64,273 |
|
|
$ |
48,502 |
|
|
$ |
15,771 |
|
|
|
32.5 |
% |
Sales increased $15.8 million, or 32.5% for the year ended December 31, 2021, compared to the year ended December 31, 2020. Revenue from our consumer market decreased $10.9 million, to $26.3 million for the year ended December 31, 2021 from $37.1 million for the year ended December 31, 2020, primarily due to the continuing weakness from global supply shortage impacting our customers' product sales. Revenue from our
49
enterprise market increased $23.5 million, to $27.4 million for the year ended December 31, 2021 from $3.9 million for the year ended December 31, 2020 primarily due to revenue generated from the sale of industrial IoT products resulting from the NimbeLink acquisition along with the launch of a Wi-Fi product for a major enterprise customer. Revenue for our automotive market grew approximately $3.2 million to $10.6 million for the year ended December 31, 2021, from $7.5 million for the year ended December 31, 2020 due to growth in sales from AirgainConnect products that were launched in the fourth quarter of 2020.
Cost of Goods Sold
|
|
For the Years Ended December 31, |
|
|||||||||||||
|
|
2021 |
|
|
2020 |
|
|
$ Change |
|
|
% Change |
|
||||
Cost of goods sold |
|
$ |
39,666 |
|
|
$ |
25,917 |
|
|
$ |
13,749 |
|
|
|
53.1 |
% |
Cost of goods sold increased $13.7 million or 53.1%, for the year ended December 31, 2021, compared to the year ended December 31, 2020, primarily due to the incremental volume and related costs from the sale of industrial IoT products resulting from the NimbeLink acquisition, growth in sales from our AirgainConnect products, higher production and freight costs, and higher amortization of intangible assets and an inventory step-up adjustment as a result of the NimbeLink acquisition.
Gross Profit
|
|
For the Years Ended December 31, |
|
|||||||||||||
|
|
2021 |
|
|
2020 |
|
|
$ Change |
|
|
% Change |
|
||||
Gross profit |
|
$ |
24,607 |
|
|
$ |
22,585 |
|
|
$ |
2,022 |
|
|
|
9.0 |
% |
Gross profit (percentage of sales) |
|
|
38.3 |
% |
|
|
46.6 |
% |
|
|
|
|
|
(8.3 |
)% |
|
Gross profit as a percentage of sales decreased by 8.3% for the year ended December 31, 2021, compared to the year ended December 31, 2020, primarily due to changes in the product mix including the sale of industrial IoT products resulting from the NimbeLink acquisition, and AirgainConnect products which yield lower gross margins, higher production and freight costs, and higher intangible asset amortization and an inventory step-up adjustment associated with the NimbeLink acquisition.
Operating Expenses
|
|
For the Years Ended December 31, |
|
|||||||||||||
|
|
2021 |
|
|
2020 |
|
|
$ Change |
|
|
% Change |
|
||||
Operating Expenses |
|
|
|
|
|
|
|
|
|
|
|
|
||||
Research and development |
|
$ |
10,920 |
|
|
$ |
9,157 |
|
|
$ |
1,763 |
|
|
|
19.3 |
% |
Sales and marketing |
|
|
10,209 |
|
|
|
6,141 |
|
|
|
4,068 |
|
|
|
66.2 |
|
General and administrative |
|
|
13,562 |
|
|
|
10,471 |
|
|
|
3,091 |
|
|
|
29.5 |
|
Change in fair value of contingent consideration |
|
|
2,040 |
|
|
|
— |
|
|
|
2,040 |
|
|
|
— |
|
Total operating expenses |
|
$ |
36,731 |
|
|
$ |
25,769 |
|
|
$ |
10,962 |
|
|
|
42.5 |
% |
Research and Development
Research and development expense increased $1.8 million or 19.3% for the year ended December 31, 2021, compared to the year ended December 31, 2020. The increase was primarily due to the acquisition of NimbeLink on January 7, 2021 which resulted in added headcount, facilities and IT expenses offset by lower product development expenses.
Sales and Marketing
Sales and marketing expense increased $4.1 million or 66.2% for the year ended December 31, 2021, compared to the year ended December 31, 2020. The increase was primarily due to the acquisition of NimbeLink on January 7, 2021, which resulted in added headcount, facilities and IT expenses as well as higher personnel-related expenses and higher advertising and tradeshow expenses.
50
General and Administrative
General and administrative expense increased $3.1 million or 29.5% for the year ended December 31, 2021, compared to the year ended December 31, 2020. The increase was primarily due to the acquisition of NimbeLink on January 7, 2021, which resulted in added headcount, facilities and IT expenses as well as higher amortization of intangible assets. In addition, stock-based compensation expense, outsourced service costs and travel costs increased for the year ended December 31, 2021 compared to 2020.
Change in Fair Value of Contingent Consideration
During the year ended December 31, 2021, we recorded a change in the fair value of contingent consideration related to the NimbeLink acquisition of $2.0 million based on revenue recorded for the year ended December 31, 2021.
Other Expense (Income)
|
|
For the Years Ended December 31, |
|
|||||||||||||
|
|
2021 |
|
|
2020 |
|
|
$ Change |
|
|
% Change |
|
||||
Other expense (income): |
|
|
|
|
|
|
|
|
|
|
|
|
||||
Interest income, net |
|
$ |
(26 |
) |
|
$ |
(197 |
) |
|
$ |
171 |
|
|
|
(86.8 |
)% |
Other expense |
|
|
38 |
|
|
|
19 |
|
|
|
19 |
|
|
|
100.0 |
|
Total other expense (income) |
|
$ |
12 |
|
|
$ |
(178 |
) |
|
$ |
190 |
|
|
|
(106.7 |
)% |
Other income decreased $0.2 million for the year ended December 31, 2021, compared to the year ended December 31, 2020 resulting in a net other expense. The decrease was primarily due to lower interest income on cash and cash equivalents and short-term investments along with the loss on disposal of fixed assets, recorded in other expense.
Liquidity and Capital Resources
We had cash, cash equivalents and restricted cash of $14.7 million at December 31, 2021.
Prior to 2013, and for the years ended 2018, 2020 and 2021, we have incurred net losses. As a result, we have an accumulated deficit of $57.4 million at December 31, 2021.
Since inception, we have primarily financed our operations and capital expenditures through private sales of preferred stock, public offerings of our common stock and cash flows from our operations. We have raised an aggregate of $29.5 million in net proceeds from the issuance of our preferred stock and convertible promissory notes and $37.0 million from the sale of common stock in public offerings.
We previously had a revolving line of credit for $10.0 million under our second amended and restated loan and security agreement with Silicon Valley Bank. As of December 31, 2019, there was no balance owed on the line of credit. The revolving line of credit expired in January 31, 2020, and the loan agreement was terminated in accordance with its terms.
On February 18, 2022, we and our subsidiary NimbeLink Corp entered into a loan and security agreement with Silicon Valley Bank, pursuant to which we together have a revolving line of credit for $4.0 million. As of the date of this annual report, there was no balance owed on the line of credit. The line of credit will only allow for maximum advances of 80% of the aggregate face amount of certain eligible receivables. The line of credit bears an interest rate of WSJ prime (currently 3.25%) plus 1.75%, and matures in February 2023. The lender has a first security interest in all of our and NimbeLink’s assets, excluding intellectual property, for which the lender has received a negative pledge.
On January 7, 2021, as a result of the Nimbelink acquisition, we assumed a revolving line of credit, or the Line of Credit, with Choice Financial Group (Choice), whereby Choice had made available to Airgain a secured credit facility of up to the lesser of (1) $1.5 million or (2) the sum of (a) 80% of the aggregate amount of third party
51
accounts receivable balances, excluding progress billings, foreign receivables, accounts subject to dispute or setoff and doubtful accounts (Eligible Accounts) aged less than 90 days, net of 10% allowance, and (b) 25% of raw materials and finished goods, except those held at named contract manufacturer, after a 10% reserve for excess and obsolete inventory. Amounts borrowed under the Line of Credit bore interest at the prime rate plus 1%, payable monthly. The facility was secured by a commercial guarantee and a lien over the property of NimbeLink including inventory, equipment, accounts receivable, investments, deposit accounts, other rights to payment and performance and general intangibles. No amounts were borrowed under this facility during the year ended December 31, 2021 and in April 2021, we closed the Line of Credit with Choice.
On September 9, 2019, our board of directors approved a new share repurchase program pursuant to which we could purchase up to $7.0 million of shares of our common stock over the twelve-month period following the establishment of the program. The repurchases under the new share repurchase program were made from time to time in the open market or in privately negotiated transactions and are funded from our working capital. Repurchases were made in compliance with Rule 10b-18 of the Securities Exchange Act of 1934, as amended, subject to market conditions, available liquidity, cash flow, applicable legal requirements and other factors. In September 2020, our board of directors approved an extension to our share repurchase program for an additional twelve-month period ending September 9, 2021. Upon expiration of the program, our Board has not authorized a new repurchase program, but may do so in the future. During the year ended December 31, 2021, we repurchased 7,200 shares of common stock under the 2019 program. These shares were repurchased at an average price per share of $13.47, for a total cost of $0.1 million. Since inception of the stock repurchase programs, including our prior share repurchase programs, we have purchased a total of 541,310 shares for a total cost of $5.4 million.
We plan to continue to invest for long-term growth, including expanding our sales force and engineering organizations and making additional capital expenditures to further penetrate markets both in the United States and internationally, as well as expanding our research and development for new product offerings and technology solutions. We anticipate that these investments will continue to increase in absolute dollars. We believe that our existing cash and cash equivalents balance together with cash proceeds from operations will be sufficient to meet our working capital requirements for at least the next 12 months.
The following table presents a summary of our cash flow activity for the periods set forth below (in thousands):
|
|
Twelve months ended December 31, |
|
|||||
|
|
2021 |
|
|
2020 |
|
||
Net cash provided by (used in) operating activities |
|
$ |
(11,170 |
) |
|
$ |
3,704 |
|
Net cash provided by (used in) investing activities |
|
|
(14,921 |
) |
|
|
20,886 |
|
Net cash provided by financing activities |
|
|
2,429 |
|
|
|
561 |
|
Net increase (decrease) in cash, cash equivalents and restricted cash |
|
$ |
(23,662 |
) |
|
$ |
25,151 |
|
Net Cash Provided by (Used in) Operating Activities. Net cash used in operating activities was $11.2 million for the year ended December 31, 2021. This was primarily driven by non-cash operating expenses of $7.4 million, including depreciation, amortization of intangible assets, the change in fair value of the contingent consideration and deferred tax liabilities. The increase in non-cash operating expenses was offset by the net loss of $10.1 million and the change in operating assets and liabilities of $8.5 million mostly associated with the timing of inventory purchases resulting in increased accounts payable and inventory balances as well as the timing of order shipments toward the second half of the fourth quarter resulting in higher accounts receivable balances.
Net cash provided by operating activities was $3.7 million for the year ended December 31, 2020. This was primarily driven by non-cash operating expenses of $3.7 million and the change in operating assets and liabilities of $3.2 million offset by a net loss of $3.3 million.
Net Cash Provided by (Used in) Investing Activities. Net cash used in investing activities was $14.9 million for the year ended December 31, 2021 of which $14.2 million was cash paid for the NimbeLink acquisition, net of cash acquired, and $0.7 million used for the purchase of property and equipment.
52
Net cash provided by investing activities was $20.9 million for the year ended December 31, 2020. This consisted of $22.4 million received from the maturity of available-for-sale securities offset by $0.8 million used to purchase of available-for-sale securities and $0.8 million purchases of property and equipment.
Net Cash Provided by Financing Activities. Net cash provided by financing activities was $2.4 million for the year ended December 31, 2021. This primarily consisted of $2.5 million proceeds from stock option exercises and employee stock plan purchases offset by $0.1 million in common stock repurchases.
Net cash provided by financing activities was $0.6 million for the year ended December 31, 2020. This primarily consisted of $1.2 million in proceeds from stock option exercises and employee stock plan purchases offset by $0.6 million in common stock repurchases.
Contractual Obligations and Commitments
We subcontract with other companies to manufacture our products. During the normal course of business, our contract manufacturers procure components based upon orders placed by us. If we cancel all or part of the orders, we may still be liable to the contract manufacturers for the cost of the components purchased by the subcontractors to manufacture our products. We periodically review the potential liability, and as of December 31, 2021 we have no significant accruals recorded. Our financial position and operating results could be negatively impacted if we were required to compensate the contract manufacturers for any unrecorded liabilities incurred.
We entered into a supply agreement with a vendor to purchase up to $2.0 million of inventory during the initial term of the agreement through December 31, 2022. As of December 31, 2021, the obligation had been met and $2.0 million has been paid under this supply agreement.
Off-Balance Sheet Arrangements
We do not have any off-balance sheet arrangements (as defined by applicable regulations of the Securities and Exchange Commission) that are reasonably likely to have a current or future material effect on our financial condition, results of operations, liquidity, capital expenditures or capital resources.
Critical Accounting Policies and Significant Judgments and Estimates
Our management’s discussion and analysis of financial condition and operating results is based on our financial statements, which have been prepared in accordance with GAAP. The preparation of these financial statements requires us to make estimates and assumptions that affect the reported amounts of assets and liabilities and the disclosure of contingent assets and liabilities at the date of the financial statements, as well as the reported sales and expenses during the reporting periods. These items are monitored and analyzed by us for changes in facts and circumstances, and material changes in these estimates could occur in the future. We base our estimates on historical experience and on various other factors that we believe are reasonable under the circumstances, the results of which form the basis for making judgments about the carrying value of assets and liabilities that are not readily apparent from other sources. Changes in estimates are reflected in reported results for the period in which they become known. Actual results may differ materially from these estimates under different assumptions or conditions.
While our significant accounting policies are more fully described in the notes to our financial statements in this annual report, we believe that the following accounting policies are critical to the process of making significant judgments and estimates in the preparation of our financial statements and understanding and evaluating our reported financial results.
Revenue Recognition
On January 1, 2019, we adopted Financial Accounting Standards Board, or FASB, Accounting Standards Codification, or ASC, Topic 606, Revenue from Contracts with Customers, or ASC 606, using the modified retrospective method. We generate revenue mainly from the sale of our wireless connectivity solutions and technologies. A portion of revenue is generated from service agreements and data subscription plans with certain customers. The revenue generated from service and data subscription plans is insignificant. We recognize revenue to depict the transfer of control of the promised goods or services to customers in an amount that reflects the
53
consideration to which the entity expects to be entitled for those goods or services. Control transfers to customers either when the products are shipped to or received by the customer, based on the terms of the specific agreement with the customer. Revenue from NimbeLink's data subscription plans is recognized over the period of the subscription.
The Company records revenue based on a five-step model in accordance with ASC 606 whereby the company (i) identifies the contract(s) with the customer, (ii) identifies the performance obligations in the contract, (iii) determines the transaction price, (iv) allocates the transaction price to the performance obligation(s) in the contract and (v) recognizes the revenue when (as) the entity satisfies performance obligations. The Company only applies the five-step model when it is probable that the entity will collect substantially all of the consideration it is entitled to in exchange for the goods or services it transfers to the customer.
For product sales, each purchase order, along with existing customer agreements, when applicable, represents a contract from a customer and each product sold represents a distinct performance obligation. The contract’s transaction price is allocated to each distinct performance obligation and recognized as revenue when, or as, the performance obligation is satisfied. The majority of our revenue is recognized on a “point-in-time” basis when control has passed to the customer. The revenue from service contracts is recognized either at a point-in-time or “over time”, based on the terms and conditions in the contract. Revenue from data subscription plans are recognized “over time”.
A portion of our sales is made through distributors under agreements allowing for pricing credits and/or rights of return under certain circumstances. A reserve for potential rights of return from distributors of $109,000 was recorded as of December 31, 2021. No reserve for potential rights of return from distributors was recorded as of December 31, 2020.
Our contracts with customers do not typically include extended payment terms. Payment terms may vary by contract and type of customer and generally range from 30 to 90 days from delivery.
We provide assurance-type warranties on all product sales ranging from one to two years. we accrue for the estimated warranty costs at the time of sale based on historical warranty experience plus any known or expected changes in warranty exposure. We accrue for the estimated warranty costs at the time of sale based on historical warranty experience plus any known or expected changes in warranty exposure. We have recorded a warranty reserve of $58,000 and $10,000 as of December 31, 2021 and December 31, 2020, respectively.
We have opted to not disclose the portion of revenues allocated to partially unsatisfied performance obligations, which represent products to be shipped within 12 months under open customer purchase orders, at the end of the current reporting period as allowed under ASC 606. We have also elected to record sales commissions when incurred, pursuant to the practical expedient under ASC 340, Other Assets and Deferred Costs, as the period over which the sales commission asset that would have been recognized is less than one year. Shipping and handling costs are immaterial and reported in operating expenses in the consolidated statement of operations.
Business Combinations
We apply the provisions of ASC 805, Business Combinations, in accounting for acquisitions. It requires us to recognize separately from goodwill the assets acquired and liabilities assumed at the acquisition date fair values. Goodwill as of the acquisition date is measured as the excess of consideration transferred over the net of the acquisition date fair values of the assets acquired and liabilities assumed. While we use our best estimates and assumptions to accurately value assets acquired and liabilities assumed at the acquisition date as well as any contingent consideration, where applicable, our estimates are inherently uncertain and subject to refinement. As a result, during the measurement period, which may be up to one year from the acquisition date, we may record adjustments to the assets acquired and liabilities assumed with the corresponding offset to goodwill. Upon the conclusion of the measurement period or final determination of the value of assets acquired or liabilities assumed,
54
whichever comes first, any subsequent adjustments are required to be recorded to our consolidated statements of operations.
In addition, uncertain tax positions and tax-related valuation allowances assumed, if any, in connection with a business combination are initially estimated as of the acquisition date. The Company re-evaluates these items quarterly based upon facts and circumstances that existed as of the acquisition date with any adjustments to the preliminary estimates being recorded to goodwill if identified within the measurement period. Subsequent to the end of the measurement period or final determination of the estimated value of the tax allowance or contingency, whichever comes first, changes to these uncertain tax positions and tax related valuation allowances will affect the income tax provision (benefit) in the consolidated statements of operations and could have a material impact on the results of operations and financial position.
Recent Accounting Pronouncements
See Note 1 of the Notes to Consolidated Financial Statements contained within this annual report for a discussion of recent accounting pronouncements.
55
ITEM 7A. QUANTITATIVE AND QUALITATIVE DISCLOSURES ABOUT MARKET RISK
We are a smaller reporting company as defined by Rule 12b-2 of the Securities Exchange Act of 1934 and are not required to provide the information under this item.
ITEM 8. FINANCIAL STATEMENTS AND SUPPLEMENTARY DATA
The financial statements and the report of our independent registered public accounting firm required pursuant to this item are included in this annual report beginning on page F-1.
ITEM 9. CHANGES IN AND DISAGREEMENTS WITH ACCOUNTANTS ON ACCOUNTING AND FINANCIAL DISCLOSURE
None.
ITEM 9A. CONTROLS AND PROCEDURES
Conclusion Regarding the Effectiveness of Disclosure Controls and Procedures
We maintain disclosure controls and procedures that are designed to ensure that information required to be disclosed in our periodic and current reports that we file with the SEC is recorded, processed, summarized and reported within the time periods specified in the SEC’s rules and forms, and that such information is accumulated and communicated to our management, including our principal executive officer and principal financial officer, as appropriate, to allow timely decisions regarding required disclosure. In designing and evaluating the disclosure controls and procedures, management recognized that any controls and procedures, no matter how well designed and operated, can provide only reasonable and not absolute assurance of achieving the desired control objectives. In reaching a reasonable level of assurance, management necessarily was required to apply its judgment in evaluating the cost-benefit relationship of possible controls and procedures. In addition, the design of any system of controls also is based in part upon certain assumptions about the likelihood of future events, and there can be no assurance that any design will succeed in achieving its stated goals under all potential future conditions; over time, control may become inadequate because of changes in conditions, or the degree of compliance with policies or procedures may deteriorate. Because of the inherent limitations in a cost-effective control system, misstatements due to error or fraud may occur and not be detected.
Our management, with the participation of our principal executive officer and principal financial officer, has evaluated the effectiveness of our disclosure controls and procedures as defined in Rules 13a-15(e) and 15d-15(e) under the Securities Exchange Act of 1934, as amended, or the Exchange Act, as of the end of the period covered by this annual report. Based on such evaluation, our principal executive officer and principal financial officer have concluded that as of such date, our disclosure controls and procedures were effective at the reasonable assurance level.
Management’s Annual Report on Internal Control Over Financial Reporting
Our management is responsible for establishing and maintaining adequate internal controls over financial reporting, as such term is defined in Rules 13a-15(f) and 15d-15(f) of the Exchange Act. Internal control over financial reporting is a process designed under the supervision and with the participation of our management, including our principal executive officer and principal financial officer, to provide reasonable assurance regarding the reliability of financial reporting and the preparation of financial statements for external purposes in accordance with GAAP. Our internal control over financial reporting includes those policies and procedures that: (i) pertain to the maintenance of records that in reasonable detail accurately and fairly reflect the transactions and dispositions of our assets, (ii) provide reasonable assurance that transactions are recorded as necessary to permit preparation of financial statements in accordance with GAAP, and that our receipts and expenditures are being made only in accordance with authorizations of our management and directors, and (iii) provide reasonable assurance regarding prevention or timely detection of unauthorized acquisition, use or disposition of our assets that could have a material effect on our financial statements. Because of its inherent limitations, internal controls over financial reporting may not prevent or detect all misstatements. Therefore, even those systems determined to be effective can provide only reasonable assurance with respect to financial statement preparation and presentation.
56
We conducted an evaluation of the effectiveness of our internal control over financial reporting. Based on our evaluation, management has concluded that our internal control over financial reporting was effective as of December 31, 2021.
Attestation Report of the Registered Public Accounting Firm
This annual report does not include an attestation report of our independent registered public accounting firm due to our non-accelerated filer status.
Changes in Internal Control Over Financial Reporting
There has been no change in our internal control over financial reporting during the quarter ended December 31, 2021 that has materially affected, or is reasonably likely to materially affect, our internal control over financial reporting.
ITEM 9B. OTHER INFORMATION
Following the filing of this annual report with the Securities and Exchange Commission, David Lyle, our former Chief Financial Officer and Secretary, will no longer be providing consulting services to us. As a result, Jacob Suen, our Chief Executive Officer, will perform the functions of our principal financial officer and our principal accounting officer until such time as our Board designates another person(s) to fulfill these roles.
ITEM 9C. DISCLOSURE REGARDING FOREIGN JURISDICTIONS THAT PREVENT INSPECTIONS
Not applicable.
57
PART III
ITEM 10. DIRECTORS, EXECUTIVE OFFICERS AND CORPORATE GOVERNANCE.
The information required by this item will be contained in our definitive proxy statement to be filed with the SEC in connection with our 2022 Annual Meeting of Stockholders, or the Definitive Proxy Statement, which we expect to file with the SEC within 120 days after the close of our year ended December 31, 2021, under the headings “Election of Directors,” “Our Executive Officers,” and “Section 16(a) Beneficial Ownership Reporting Compliance,” and is incorporated herein by reference.
Code of Business Conduct and Ethics
We adopted a Code of Business Conduct and Ethics that applies to our officers, directors and employees which is available, free of charge, on our website at www.airgain.com. The Code of Business Conduct and Ethics contains general guidelines for conducting the business of our company consistent with the highest standards of business ethics, and is intended to qualify as a “code of ethics” within the meaning of Section 406 of the Sarbanes-Oxley Act of 2002 and Item 406 of Regulation S-K. In addition, we intend to promptly disclose on our website in the future (i) the nature of any amendment to our Code of Business Conduct and Ethics that applies to our principal executive officer, principal financial officer, principal accounting officer or controller or persons performing similar functions, and (ii) the nature of any waiver, including an implicit waiver, from a provision of our Code of Business Conduct and Ethics that is granted to one of these specified officers, the name of such person who is granted the waiver and the date of the waiver.
ITEM 11. EXECUTIVE COMPENSATION
The information required by this item will be contained in our Definitive Proxy Statement under the heading “Executive Compensation and Other Information” and is incorporated herein by reference.
ITEM 12. SECURITY OWNERSHIP OF CERTAIN BENEFICIAL OWNERS AND MANAGEMENT AND RELATED STOCKHOLDER MATTERS
The information required by this item will be set forth in the section headed “Security Ownership of Certain Beneficial Owners and Management” in our Definitive Proxy Statement and is incorporated herein by reference.
The information required by Item 201(d) of Regulation S-K will be set forth in the section headed “Executive Compensation and Other Information” in our Proxy Statement and is incorporated herein by reference.
ITEM 13. CERTAIN RELATIONSHIPS AND RELATED TRANSACTIONS, AND DIRECTOR INDEPENDENCE
The information required by this item will be set forth in the section headed “Certain Relationships and Related Person Transactions,” “Board Independence” and “Board Committees and Independence” in our Definitive Proxy Statement and is incorporated herein by reference.
ITEM 14. PRINCIPAL ACCOUNTING FEES AND SERVICES
The information required by this item will be set forth in the section headed “Independent Registered Public Accounting Firm’s’ Fees” in our Definitive Proxy Statement and is incorporated herein by reference.
58
PART IV
ITEM 15. EXHIBITS, FINANCIAL STATEMENT SCHEDULES
The financial statements of Airgain, Inc., together with the report thereon of KPMG LLP, an independent registered public accounting firm, are included in this annual report on Form 10-K.
All schedules are omitted because they are not applicable, or the required information is shown in the financial statements or notes thereto.
A list of exhibits is set forth on the Exhibit Index immediately preceding the signature page of this annual report on Form 10-K and is incorporated herein by reference.
ITEM 16. FORM 10-K SUMMARY
None.
59
Airgain, Inc.
Index to Financial Statements
|
|
|
Page |
F-2 |
|
F-4 |
|
F-5 |
|
F-6 |
|
F-7 |
|
F-8 |
|
F-9 |
F-1
Report of Independent Registered Public Accounting Firm
To the Stockholders and Board of Directors
Airgain, Inc.:
Opinion on the Consolidated Financial Statements
We have audited the accompanying consolidated balance sheets of Airgain, Inc. and subsidiary (the Company) as of December 31, 2021 and 2020, the related consolidated statements of operations, comprehensive loss, stockholders’ equity, and cash flows for each of the years in the two-year period ended December 31, 2021, and the related notes (collectively, the consolidated financial statements). In our opinion, the consolidated financial statements present fairly, in all material respects, the financial position of the Company as of December 31, 2021 and 2020, and the results of its operations and its cash flows for each of the years in the two-year period ended December 31, 2021, in conformity with U.S. generally accepted accounting principles.
Change in Accounting Principle
As discussed in Notes 2 and 11 to the consolidated financial statements, the Company has changed its method of accounting for leases as of January 1, 2021 due to the adoption of Accounting Standards Codification Topic 842, Leases.
Basis for Opinion
These consolidated financial statements are the responsibility of the Company’s management. Our responsibility is to express an opinion on these consolidated financial statements based on our audits. We are a public accounting firm registered with the Public Company Accounting Oversight Board (United States) (PCAOB) and are required to be independent with respect to the Company in accordance with the U.S. federal securities laws and the applicable rules and regulations of the Securities and Exchange Commission and the PCAOB.
We conducted our audits in accordance with the standards of the PCAOB. Those standards require that we plan and perform the audit to obtain reasonable assurance about whether the consolidated financial statements are free of material misstatement, whether due to error or fraud. The Company is not required to have, nor were we engaged to perform, an audit of its internal control over financial reporting. As part of our audits, we are required to obtain an understanding of internal control over financial reporting but not for the purpose of expressing an opinion on the effectiveness of the Company’s internal control over financial reporting. Accordingly, we express no such opinion.
Our audits included performing procedures to assess the risks of material misstatement of the consolidated financial statements, whether due to error or fraud, and performing procedures that respond to those risks. Such procedures included examining, on a test basis, evidence regarding the amounts and disclosures in the consolidated financial statements. Our audits also included evaluating the accounting principles used and significant estimates made by management, as well as evaluating the overall presentation of the consolidated financial statements. We believe that our audits provide a reasonable basis for our opinion.
Critical Audit Matter
The critical audit matter communicated below is a matter arising from the current period audit of the consolidated financial statements that was communicated or required to be communicated to the audit committee and that: (1) relates to accounts or disclosures that are material to the consolidated financial statements and (2) involved our especially challenging, subjective, or complex judgments. The communication of critical audit matters does not alter in any way our opinion on the consolidated financial statements, taken as a whole, and we are not, by communicating the critical audit matter below, providing a separate opinion on the critical audit matter or on the accounts or disclosures to which it relates.
Fair value of measurement of contingent consideration and intangible assets acquired in the NimbeLink Acquisition
As described in Note 4 to the consolidated financial statements, the Company completed the acquisition of NimbeLink Corp. (NimbeLink) on January 7, 2021 for total purchase consideration $22.7 million. The total purchase consideration includes the estimated fair value of contingent consideration, which NimbeLink’s former
F-2
security holders may receive, subject to the acquired business’s achievement of certain revenue targets in 2021. The NimbeLink acquisition was accounted for as a business combination and the identifiable assets acquired and liabilities assumed were recorded at their fair values as of the acquisition date. The acquisition date fair values for the contingent consideration and identifiable intangible assets are $6.0 million and $14.1 million, respectively.
We identified the evaluation of the acquisition date fair value measurement of the contingent consideration and certain intangible assets, including customer relationships, market-related, developed technology, and in-process research and development as a critical audit matter. There was a high degree of complex auditor judgment in evaluating the key assumptions used to estimate the fair value of the contingent consideration and certain intangible assets. Specifically, key assumptions included the forecasted revenue growth rates. In addition, valuation professionals with specialized skills and knowledge were needed to assist in performing certain audit procedures.
The following are the primary procedures we performed to address this critical audit matter. We evaluated the design of certain internal controls related to the valuation of the contingent consideration and certain intangible assets. This included controls related to the review of the forecasted revenue growth rates assumptions. We evaluated the Company’s forecasted revenue growth rates assumptions related to the contingent consideration and certain intangible assets by comparing them to actual revenue growth rates historically experienced by NimbeLink. In addition, we involved valuation professionals with specialized skills and knowledge, who assisted in identifying revenue growth rates from publicly available market data for comparable entities, which we compared to the Company’s forecasted revenue growth rates assumptions. We also compared the Company’s forecasted revenue growth rate assumptions of NimbeLink for the period since the acquisition date to its actual results to assess the Company’s ability to accurately forecast.
/s/ KPMG LLP
We have served as the Company’s auditor since 2012.
San Diego, California
March 21, 2022
F-3
Airgain, Inc.
Consolidated Balance Sheets
(in thousands, except par value)
|
|
December 31, |
|
|
December 31, |
|
||
|
|
2021 |
|
|
2020 |
|
||
Assets |
|
|
|
|
|
|
||
Current assets: |
|
|
|
|
|
|
||
Cash and cash equivalents |
|
$ |
|
|
$ |
|
||
Trade accounts receivable, net |
|
|
|
|
|
|
||
Inventory |
|
|
|
|
|
|
||
Prepaid expenses and other current assets |
|
|
|
|
|
|
||
Total current assets |
|
|
|
|
|
|
||
Property and equipment, net |
|
|
|
|
|
|
||
Leased right-of-use assets |
|
|
|
|
|
|
||
Goodwill |
|
|
|
|
|
|
||
Intangible assets, net |
|
|
|
|
|
|
||
Other assets |
|
|
|
|
|
|
||
Total assets |
|
$ |
|
|
$ |
|
||
Liabilities and stockholders’ equity |
|
|
|
|
|
|
||
Current liabilities: |
|
|
|
|
|
|
||
Accounts payable |
|
$ |
|
|
$ |
|
||
Accrued compensation |
|
|
|
|
|
|
||
Accrued liabilities and other |
|
|
|
|
|
|
||
Short-term lease liabilities |
|
|
|
|
|
|
||
Deferred purchase price liabilities |
|
|
|
|
|
|
||
Current portion of deferred rent obligation under operating lease |
|
|
|
|
|
|
||
Total current liabilities |
|
|
|
|
|
|
||
Deferred tax liability |
|
|
|
|
|
|
||
Long-term lease liabilities |
|
|
|
|
|
|
||
Deferred rent obligation under operating lease |
|
|
|
|
|
|
||
Total liabilities |
|
|
|
|
|
|
||
|
|
|
|
|
|
|||
Stockholders’ equity: |
|
|
|
|
|
|
||
Common stock and additional paid-in capital, par value $ |
|
|
|
|
|
|
||
Treasury stock, at cost: |
|
|
( |
) |
|
|
( |
) |
Accumulated other comprehensive income |
|
|
|
|
|
|
||
Accumulated deficit |
|
|
( |
) |
|
|
( |
) |
Total stockholders’ equity |
|
|
|
|
|
|
||
Total liabilities and stockholders’ equity |
|
$ |
|
|
$ |
|
||
See accompanying notes.
F-4
Airgain, Inc.
Consolidated Statements of Operations
(in thousands, except per share data)
|
|
For the Years Ended December 31, |
|
|||||
|
|
2021 |
|
|
2020 |
|
||
Sales |
|
$ |
|
|
$ |
|
||
Cost of goods sold |
|
|
|
|
|
|
||
Gross profit |
|
|
|
|
|
|
||
Operating expenses: |
|
|
|
|
|
|
||
Research and development |
|
|
|
|
|
|
||
Sales and marketing |
|
|
|
|
|
|
||
General and administrative |
|
|
|
|
|
|
||
Change in fair value of contingent consideration |
|
|
|
|
|
|
||
Total operating expenses |
|
|
|
|
|
|
||
Loss from operations |
|
|
( |
) |
|
|
( |
) |
Other expense (income): |
|
|
|
|
|
|
||
Interest income, net |
|
|
( |
) |
|
|
( |
) |
Other expense |
|
|
|
|
|
|
||
Total other expense (income) |
|
|
|
|
|
( |
) |
|
Loss before income taxes |
|
|
( |
) |
|
|
( |
) |
Provision (benefit) for income taxes |
|
|
( |
) |
|
|
|
|
Net loss |
|
$ |
( |
) |
|
$ |
( |
) |
Net loss per share: |
|
|
|
|
|
|
||
Basic |
|
$ |
( |
) |
|
$ |
( |
) |
Diluted |
|
$ |
( |
) |
|
$ |
( |
) |
Weighted average shares used in calculating loss per share: |
|
|
|
|
|
|
||
Basic |
|
|
|
|
|
|
||
Diluted |
|
|
|
|
|
|
||
See accompanying notes.
F-5
Airgain, Inc.
Consolidated Statements of Comprehensive Loss
(in thousands)
|
|
For the Years Ended December 31, |
|
|||||
|
|
2021 |
|
|
2020 |
|
||
Net loss |
|
$ |
( |
) |
|
$ |
( |
) |
Unrealized loss on available-for-sale securities, net of deferred taxes |
|
|
|
|
|
( |
) |
|
Comprehensive loss |
|
$ |
( |
) |
|
$ |
( |
) |
See accompanying notes.
F-6
Airgain, Inc.
Consolidated Statements of Stockholders’ Equity
(in thousands)
|
|
For the Years Ended December 31, |
|
|||||
|
|
2021 |
|
|
2020 |
|
||
Total stockholders' equity, beginning balance |
|
$ |
|
|
$ |
|
||
|
|
|
|
|
|
|
||
Common stock and additional paid-in capital: |
|
|
|
|
|
|
||
Balance at beginning of period |
|
|
|
|
|
|
||
Stock-based compensation |
|
|
|
|
|
|
||
Replacement awards issued in relation to acquisition |
|
|
|
|
|
|
||
Issuance of shares for stock purchase plan |
|
|
|
|
|
|
||
Balance at end of period |
|
|
|
|
|
|
||
|
|
|
|
|
|
|
||
Treasury stock: |
|
|
|
|
|
|
||
Balance at beginning of period |
|
|
( |
) |
|
|
( |
) |
Repurchases of common stock |
|
|
( |
) |
|
|
( |
) |
Balance at end of period |
|
|
( |
) |
|
|
( |
) |
|
|
|
|
|
|
|
||
Accumulated other comprehensive income (loss): |
|
|
|
|
|
|
||
Balance at beginning of period |
|
|
|
|
|
|
||
Unrealized loss on available-for-sale securities, net of deferred taxes |
|
|
|
|
|
( |
) |
|
Balance at end of period |
|
|
|
|
|
|
||
|
|
|
|
|
|
|
||
Accumulated deficit: |
|
|
|
|
|
|
||
Balance at beginning of period |
|
|
( |
) |
|
|
( |
) |
Net loss |
|
|
( |
) |
|
|
( |
) |
Balance at end of period |
|
|
( |
) |
|
|
( |
) |
|
|
|
|
|
|
|
||
Total stockholders' equity, ending balance |
|
$ |
|
|
$ |
|
||
See accompanying notes.
F-7
Airgain, Inc.
Consolidated Statements of Cash Flows
(in thousands)
|
|
For the Years Ended December 31, |
|
|||||
|
|
2021 |
|
|
2020 |
|
||
Cash flows from operating activities: |
|
|
|
|
|
|
||
Net loss |
|
$ |
( |
) |
|
$ |
( |
) |
Adjustments to reconcile net loss to net cash provided by (used in) operating activities: |
|
|
|
|
|
|
||
Depreciation |
|
|
|
|
|
|
||
Loss on disposal of property and equipment |
|
|
|
|
|
|
||
Amortization of intangible assets |
|
|
|
|
|
|
||
Amortization of premium on investments, net |
|
|
|
|
|
|
||
Stock-based compensation |
|
|
|
|
|
|
||
Change in fair value of contingent consideration |
|
|
|
|
|
|
||
Deferred tax liability |
|
|
( |
) |
|
|
|
|
Changes in operating assets and liabilities: |
|
|
|
|
|
|
||
Trade accounts receivable |
|
|
( |
) |
|
|
|
|
Inventory |
|
|
( |
) |
|
|
|
|
Prepaid expenses and other current assets |
|
|
|
|
|
( |
) |
|
Other assets |
|
|
|
|
|
|
||
Accounts payable |
|
|
|
|
|
( |
) |
|
Accrued compensation |
|
|
( |
) |
|
|
|
|
Accrued liabilities and other |
|
|
|
|
|
|
||
Lease liabilities |
|
|
( |
) |
|
|
|
|
Deferred obligation under operating lease |
|
|
|
|
|
|
||
Net cash provided by (used in) operating activities |
|
|
( |
) |
|
|
|
|
Cash flows from investing activities: |
|
|
|
|
|
|
||
Cash paid for acquisition, net of cash acquired |
|
|
( |
) |
|
|
|
|
Purchases of available-for-sale securities |
|
|
|
|
|
( |
) |
|
Maturities of available-for-sale securities |
|
|
|
|
|
|
||
Purchases of property and equipment |
|
|
( |
) |
|
|
( |
) |
Net cash provided by (used in) investing activities |
|
|
( |
) |
|
|
|
|
Cash flows from financing activities: |
|
|
|
|
|
|
||
Repurchases of common stock |
|
|
( |
) |
|
|
( |
) |
Proceeds from issuance of common stock, net |
|
|
|
|
|
|
||
Net cash provided by financing activities |
|
|
|
|
|
|
||
Net increase (decrease) in cash, cash equivalents and restricted cash |
|
|
( |
) |
|
|
|
|
Cash, cash equivalents, and restricted cash; beginning of period |
|
|
|
|
|
|
||
Cash, cash equivalents, and restricted cash; end of period |
|
$ |
|
|
$ |
|
||
|
|
|
|
|
|
|
||
Supplemental disclosure of cash flow information: |
|
|
|
|
|
|
||
Interest paid |
|
$ |
|
|
$ |
|
||
Taxes paid |
|
$ |
|
|
$ |
|
||
Supplemental disclosure of non-cash investing and financing activities: |
|
|
|
|
|
|
||
Right-of-use assets recorded upon adoption of ASC 842 |
|
$ |
|
|
$ |
|
||
Leased liabilities recorded upon adoption of ASC 842 |
|
$ |
|
|
$ |
|
||
Accrual of property and equipment |
|
$ |
|
|
$ |
|
||
|
|
|
|
|
|
|
||
Cash and cash equivalents and restricted cash |
|
$ |
|
|
$ |
|
||
Restricted cash included in other assets |
|
|
|
|
|
|
||
Total cash, cash equivalents, and restricted cash |
|
$ |
|
|
$ |
|
||
See accompanying notes.
F-8
Airgain, Inc.
Notes to Consolidated Financial Statements
Note 1. Description of Business and Basis of Presentation
Description of Business
Airgain, Inc. (the Company) was incorporated in the State of California on March 20, 1995, and reincorporated in the State of Delaware on August 17, 2016. The Company is a leading provider of advanced wireless connectivity solutions and technologies used to enable high performance wireless networking across a broad and increasing range of devices and markets, including consumer, enterprise, and automotive. The Company’s headquarters is in San Diego, California with office space and research, design, and test facilities in the United States, United Kingdom, China, and Taiwan.
Basis of Presentation and Principles of Consolidation
The consolidated financial statements include the accounts of the Company and its wholly owned subsidiary and have been prepared in accordance with accounting principles generally accepted in the United States of America (GAAP). All intercompany transactions and investments have been eliminated in consolidation.
Segment Information
The Company’s operations are located primarily in the United States and most of its assets are located in San Diego, California, Scottsdale, Arizona and Plymouth, Minnesota. The Company operates in
Use of Estimates
Reclassifications
Note 2. Significant Accounting Policies
Cash Equivalents
Cash equivalents are comprised of short-term, highly liquid investments with maturities of 90 days or less at the date of purchase.
Restricted Cash
As of December 31, 2021, the Company has $
F-9
Trade Accounts Receivable
Inventory
The majority of the Company’s products are manufactured by third parties that retain ownership of the inventory until title is transferred to the customer at the shipping point. In some situations, the Company retains ownership of inventory which is held in third party contract manufacturing facilities. In certain instances, shipping terms are delivery-at-place and the Company is responsible for arranging transportation and delivery of goods ready for unloading at the named place. In those instances, the Company bears all risk involved in bringing the goods to the named place and records the related inventory in transit to the customer as inventory on the accompanying balance sheet. The Company also manufactures certain of its products at its facility located in Scottsdale, Arizona.
Property and Equipment
Goodwill
Intangibles
The Company’s identifiable intangible assets are comprised of acquired market-related intangibles, developed technologies, customer relationships and non-compete agreements. The cost of the identifiable intangible assets with finite lives is amortized on a straight-line basis over the assets’ respective estimated useful lives. The Company periodically re-evaluates the original assumptions and estimated lives of long-lived assets and finite-lived intangible assets. Long-lived assets and finite-lived intangibles are assessed for impairment whenever events or changes in circumstances indicate that the carrying amount of an asset may not be recoverable. If an asset is considered to be impaired the impairment recognized is equal to the amount by which the carrying value of the asset exceeds its fair value.
F-10
Business Combinations
The Company applies the provisions of ASC 805, Business Combinations, in accounting for its acquisitions. It requires the Company to recognize separately from goodwill the assets acquired and the liabilities assumed, at the acquisition date fair values. Goodwill as of the acquisition date is measured as the excess of consideration transferred over the acquisition date fair values of the net assets acquired and the liabilities assumed. While the Company uses its best estimates and assumptions to accurately value assets acquired and liabilities assumed at the acquisition date, as well as the contingent consideration, where applicable, its estimates are inherently uncertain and subject to refinement. As a result, during the measurement period, which may be up to one year from the acquisition date, the Company records adjustments to the assets acquired and liabilities assumed with the corresponding offset to goodwill. Upon the conclusion of the measurement period or final determination of the values of assets acquired or liabilities assumed, whichever comes first, any subsequent adjustments are recorded to the consolidated statements of operations.
In addition, uncertain tax positions and tax-related valuation allowances assumed, if any, in connection with a business combination are initially estimated as of the acquisition date. The Company re-evaluates these items quarterly based upon facts and circumstances that existed as of the acquisition date with any adjustments to the preliminary estimates being recorded to goodwill if identified within the measurement period. Subsequent to the end of the measurement period or final determination of the estimated value of the tax allowance or contingency, whichever comes first, changes to these uncertain tax positions and tax related valuation allowances will affect the income tax provision (benefit) in the consolidated statements of operations and could have a material impact on the results of operations and financial position.
On January 1, 2019, the Company adopted Financial Accounting Standards Board, or FASB, Accounting Standards Codification, or ASC, Topic 606, Revenue from Contracts with Customers, or ASC 606, using the modified retrospective method. The Company generates revenue mainly from the sale of wireless connectivity solutions and technologies. A portion of revenue is generated from service agreements and data subscription plans with certain customers. The revenue generated from service and data subscription plans is insignificant. The Company recognizes revenue to depict the transfer of control of the promised goods or services to customers in an amount that reflects the consideration to which the entity expects to be entitled for those goods or services. Control transfers to customers either when the products are shipped to or received by the customer, based on the terms of the specific agreement with the customer. Revenue from NimbeLink's data subscription plans is recognized over the period of the subscription.
The Company records revenue based on a five-step model in accordance with ASC 606 whereby the company (i) identifies the contract(s) with the customer, (ii) identifies the performance obligations in the contract, (iii) determines the transaction price, (iv) allocates the transaction price to the performance obligation(s) in the contract and (v) recognizes the revenue when (as) the entity satisfies performance obligations. The Company only applies the five-step model when it is probable that the entity will collect substantially all of the consideration it is entitled to in exchange for the goods or services it transfers to the customer.
For product sales, each purchase order, along with existing customer agreements, when applicable, represents a contract from a customer and each product sold represents a distinct performance obligation. The contract’s transaction price is allocated to each distinct performance obligation and recognized as revenue when, or as, the performance obligation is satisfied. The majority of our revenue is recognized on a “point-in-time” basis when control has passed to the customer. The revenue from service contracts is recognized either at a "point-in-time" or “over time” based on the terms and conditions in the contract. Revenue from data subscription plans are recognized “over time”.
A portion of the Company's sales is made through distributors under agreements allowing for pricing credits and/or rights of return under certain circumstances. A reserve for potential rights of return from distributors of $
F-11
The Company's contracts with customers do not typically include extended payment terms. Payment terms may vary by contract and type of customer and generally range from
The Company provides assurance-type warranties on all product sales ranging from one to two years. The estimated warranty costs are accrued for at the time of sale based on historical warranty experience plus any known or expected changes in warranty exposure. The Company has recorded a warranty reserve of $
The Company has opted to not disclose the portion of revenues allocated to partially unsatisfied performance obligations, which represent products to be shipped within 12 months under open customer purchase orders, at the end of the current reporting period as allowed under ASC 606. The Company has also elected to record sales commissions when incurred, pursuant to the practical expedient under ASC 340, Other Assets and Deferred Costs, as the period over which the sales commission asset that would have been recognized is less than one year.
Shipping and Transportation Costs
Shipping and other transportation costs—expensed as incurred—were $
Research and Development Costs
Advertising Costs
Advertising costs—expensed as incurred—were $
Income Taxes
The Company records income taxes under the asset and liability method. Deferred tax assets and liabilities are recognized for the future tax consequences attributable to differences between the financial statements carrying amounts of existing assets and liabilities and their respective tax bases. Deferred tax assets and liabilities are measured using enacted tax rates expected to apply to taxable income in the years in which those temporary differences are expected to be recovered or settled. The effect on deferred tax assets and liabilities of a change in tax rates is recognized in income in the period that includes the enactment date. When applicable a valuation allowance is established to reduce any deferred tax asset when it is determined that it is more likely than not that some portion of the deferred tax asset will not be realized.
Stock-Based Compensation
We recognize compensation costs related to stock options and restricted stock units granted to employees and directors based on the estimated fair value of the awards on the date of grant. We estimate the grant date fair value, and the resulting stock-based compensation expense, using the Black-Scholes option-pricing model. The grant date fair value of stock-based awards is expensed on a straight-line basis over the vesting period of the respective award.
F-12
The assumptions used in the Black-Scholes option-pricing model are as follows:
Fair Value Measurements
The carrying values of the Company’s financial instruments, including cash, trade accounts receivable, accounts payable, accrued liabilities and deferred purchase price obligations approximate their fair values due to the short maturity of these instruments.
Fair value measurements are market-based measurements, not entity-specific measurements. Therefore, fair value measurements are determined based on the assumptions that market participants would use in pricing the asset or liability. The Company follows a three-level hierarchy to prioritize the inputs used in the valuation techniques to derive fair values. The basis for fair value measurements for each level within the hierarchy is described below:
Recently Adopted Accounting Pronouncements
In February 2016, the FASB issued ASU No. 2016-02, Leases (Topic 842), which requires lessees to recognize most leases on their balance sheets as lease liabilities, representing a liability to make lease payments, and corresponding right-of-use assets representing its right to use the underlying asset. The Company adopted the new accounting standard using the modified retrospective transition option as of the effective date on January 1, 2021. The adoption of this standard had a material impact on the Company's consolidated balance sheets. The adoption did not have an impact on the Company's consolidated statements of operations. See Note 11 for disclosures related to the adoption of this standard.
In December 2019, the FASB issued ASU No. 2019-12, Simplifying the Accounting for Income Taxes, as part of its initiative to reduce complexity in accounting standards. The amendments in the ASU include removing exceptions to incremental intraperiod tax allocation of losses and gains from different financial statement components, exceptions to the method of recognizing income taxes on interim period losses, and exceptions to deferred tax liability recognition related to foreign subsidiary investments. In addition, the ASU requires that entities recognize franchise tax based on an incremental method and requires an entity to evaluate the accounting for step-ups in the tax basis of goodwill as inside or outside of a business combination. The Company has adopted this
F-13
standard as of January 1, 2021. The adoption of this standard did not have a material impact on the Company's consolidated financial statements.
Recently Issued Accounting Pronouncements
In June 2016, the FASB issued ASU 2016-13, Financial Instruments-Credit Losses (Topic 326), Measurement of Credit Losses on Financial Instruments. This standard changes the methodology for measuring credit losses on financial instruments and the timing of when such losses are recorded. In December 2019, the FASB issued ASU 2019-10, Effective Dates which updated the effective dates of adoption of ASU 2016-13 for Smaller Reporting Companies, for annual and interim periods in fiscal years beginning after December 15, 2022. Companies are required to adopt the standard using a modified retrospective adoption method. The Company continues to evaluate the impact of the standard on its financial statements.
In May 2019, the FASB issued ASU 2019-05, Financial Instruments-Credit Losses (Topic 326), Targeted Transition Relief, which provides entities that have certain instruments within the scope of ASC 326-20, Financial Instruments-Credit Losses-Measured at Amortized Cost, with an option to irrevocably elect the fair value option for eligible instruments. The effective date and transition methodology for this standard are the same as in ASU 2016-13. The Company continues to evaluate the impact of the standard on its financial statements.
In April 2021, the FASB issued ASU 2021-04, Earnings Per Share (Topic 260), Debt—Modifications and Extinguishments (Subtopic 470-50), Compensation—Stock Compensation (Topic 718), and Derivatives and Hedging—Contracts in Entity’s Own Equity (Subtopic 815-40), Issuer’s Accounting for Certain Modifications or Exchanges of Freestanding Equity-Classified Written Call Options. This guidance clarifies and reduces diversity in an issuer’s accounting for modifications or exchanges of freestanding equity-classified written call options due to a lack of explicit guidance in the FASB Codification. The ASU 2021-04 is effective for all entities for fiscal years beginning after December 15, 2021. Early adoption is permitted. The Company is currently evaluating the impact of adopting ASU 2021-04 on its consolidated financial statements.
Note 3. Net Loss Per Share
Basic net loss per share is calculated by dividing net loss available to common stockholders by the weighted average shares of common stock outstanding for the period. Diluted net loss per share is calculated by dividing net loss by the weighted average shares of common stock outstanding for the period plus amounts representing the dilutive effect of securities that are convertible into common stock. The Company calculates diluted loss per common share using the treasury stock method.
The following table presents the computation of net loss per share (in thousands, except per share data):
|
|
For the Years Ended December 31, |
|
|||||
|
|
2021 |
|
|
2020 |
|
||
Numerator: |
|
|
|
|
|
|
||
Net loss |
|
$ |
( |
) |
|
$ |
( |
) |
Denominator: |
|
|
|
|
|
|
||
Basic weighted average common shares outstanding |
|
|
|
|
|
|
||
Diluted weighted average common shares outstanding |
|
|
|
|
|
|
||
Net loss per share: |
|
|
|
|
|
|
||
Basic |
|
$ |
( |
) |
|
$ |
( |
) |
Diluted |
|
$ |
( |
) |
|
$ |
( |
) |
F-14
Potentially dilutive securities (in common stock equivalent shares) not included in the calculation of diluted net income (loss) per share because to do so would be anti-dilutive are as follows:
|
|
For the Years Ended December 31, |
|
|||||
|
|
2021 |
|
|
2020 |
|
||
Stock options and restricted stock |
|
|
|
|
|
|
||
Warrants outstanding |
|
|
|
|
|
|
||
Total common stock equivalent shares |
|
|
|
|
|
|
||
Note 4. Business Combinations
On January 7, 2021, the Company entered into a Stock Purchase Agreement, by and among the Company, NimbeLink, the sellers set forth therein (the Sellers) and Scott Schwalbe in his capacity as seller representative (the Purchase Agreement). NimbeLink is an industrial Internet of Things (IoT) company focused on the design, development and delivery of edge-based cellular connectivity solutions for enterprise customers. The acquisition of NimbeLink supports the Company's transition toward becoming a more system-level company and will play an important role in the Company's overall growth strategy to broaden market diversification, especially within the industrial IoT space.
Pursuant to the Purchase Agreement, at the closing on January 7, 2021, the Company acquired all of the outstanding stock of NimbeLink for an upfront cash purchase price of approximately $
Acquisition Consideration
The following table summarizes the fair value of purchase consideration to acquire NimbeLink (in thousands):
Cash |
|
|
|
|
Deferred payments(1) |
|
|
|
|
Contingent consideration(2) |
|
|
|
|
Replacement options(3) |
|
|
|
|
Total purchase consideration |
|
$ |
|
(1) The fair value of the holdback payment was determined by discounting to present value, payments totaling $
(2) The fair value of contingent consideration is based on applying the Monte Carlo simulation method to forecast achievement under various contingent consideration events which may result in up to $
(3) Represents the pre-combination stock compensation expense for replacement options issued to NimbeLink employees.
F-15
Purchase Price Allocation
The following is an allocation of purchase price as of the closing date based upon an estimate of the fair value of the assets acquired and liabilities assumed by the Company in the acquisition (in thousands):
Cash |
|
$ |
|
|
Accounts receivable |
|
|
|
|
Inventory |
|
|
|
|
Prepaids and other current assets |
|
|
|
|
Property and equipment |
|
|
|
|
Right of use assets |
|
|
|
|
Other assets |
|
|
|
|
Identified intangible assets |
|
|
|
|
Accounts payable |
|
|
( |
) |
Accrued compensation |
|
|
( |
) |
Accrued expenses and other current liabilities |
|
|
( |
) |
Short-term lease liabilities |
|
|
( |
) |
Long-term lease liabilities |
|
|
( |
) |
Deferred tax liabilities |
|
|
( |
) |
Identifiable net assets acquired |
|
|
|
|
Goodwill |
|
|
|
|
Total purchase price |
|
$ |
|
The following is a summary of identifiable intangible assets acquired and the related expected lives for the finite-lived intangible assets (in thousands):
Category |
|
Estimated |
|
Fair value |
|
|
Finite-lived intangible assets |
|
|
|
|
|
|
Market-related intangibles |
|
|
$ |
|
||
Customer relationships |
|
|
|
|
||
Developed technology |
|
|
|
|
||
Covenants to non-compete |
|
|
|
|
||
Indefinite-lived intangible assets |
|
|
|
|
|
|
In-process research and development |
|
N/A |
|
|
|
|
Total identifiable intangible assets acquired |
|
|
|
$ |
|
|
Assumptions in the Allocations of Purchase Price
Management prepared the purchase price allocations and in doing so considered or relied in part upon reports of a third-party valuation expert to calculate the fair value of certain acquired assets, which primarily included identifiable intangible assets and inventory, and the portions of the purchase consideration expected to be paid to NimbeLink securityholders in the future, as described above. Certain NimbeLink securityholders that are employees are not required to remain employed in order to receive the deferred payments and contingent consideration; accordingly, the fair value of the deferred payments and contingent consideration have been accounted for as a portion of the purchase consideration.
Estimates of fair value require management to make significant estimates and assumptions. The Company recorded $
F-16
operations for the year ended December 31, 2021. The contingent consideration and holdback payment is expected to be paid in the second quarter of 2022.
The goodwill recognized is attributable primarily to the acquired workforce, expected synergies, and other benefits that the Company believes will result from integrating the operations of the NimbeLink business with the operations of the Company. Certain liabilities included in the purchase price allocations are based on management’s best estimates of the amounts to be paid or settled and based on information available at the time the purchase price allocations were prepared. There have been no adjustments between the preliminary purchase price allocations reflected as of March 31, 2021 and the purchase price allocation reflected as of December 31, 2021.
The fair value of the customer relationships was determined using the multi-period excess earnings method (MPEEM). MPEEM estimates the value of an intangible asset by quantifying the amount of residual (or excess) cash flows generated by the asset, and discounting those cash flows to the present. Future cash flows for contractual and non-contractual customers were estimated based on forecasted revenue and costs, taking into account the growth rates and contributory charges. The fair value of market-related intangible assets, developed technology, and in-process research and development (IPR&D) was determined using the Relief-from-Royalty method. The Relief-from-Royalty method is a specific application of the discounted-cash-flow method, which is a form of the income approach. It is based on the principle that ownership of the intangible asset relieves the owner of the need to pay a royalty to another party in exchange for rights to use the asset. Key assumptions to estimate the hypothetical royalty rate include observable royalty rates, which are royalty rates in negotiated licenses and market-based royalty rates which are royalty rates found in available market data for licenses involving similar assets. Developed technology will begin amortizing immediately and IPR&D will begin amortizing upon the completion of each project. During the year ended December 31, 2021, all IPR&D projects were completed and transferred to developed technology, with a
The Company assumed liabilities in the acquisition which primarily consist of accrued employee compensation and certain operating liabilities. The liabilities assumed in these acquisitions are included in the respective purchase price allocations above.
Goodwill recorded in connection with the NimbeLink acquisition was $
Supplemental proforma financial information
The following unaudited pro forma financial information presents the combined results of operations for each of the periods presented as if the NimbeLink acquisition had occurred at the beginning of 2020 (in thousands):
|
|
For the Years Ended December 31, |
|
|||||
|
|
2021 |
|
|
2020 |
|
||
Net revenue - pro forma combined |
|
$ |
|
|
$ |
|
||
Net loss - pro forma combined |
|
|
( |
) |
|
|
( |
) |
The following adjustments were included in the unaudited pro forma combined net revenues (in thousands):
|
|
For the Years Ended December 31, |
|
|||||
|
|
2021 |
|
|
2020 |
|
||
Net revenue |
|
$ |
|
|
$ |
|
||
Add: Net revenue - acquired businesses |
|
|
|
|
|
|
||
Net revenues - pro-forma combined |
|
$ |
|
|
$ |
|
||
F-17
The following adjustments were included in the unaudited pro forma combined net income (loss) (in thousands):
|
|
For the Years Ended December 31, |
|
|||||
|
|
2021 |
|
|
2020 |
|
||
Net income (loss) |
|
$ |
( |
) |
|
$ |
( |
) |
Add: Results of operations of acquired business |
|
|
( |
) |
|
|
|
|
Less: pro forma adjustments |
|
|
|
|
|
|
||
Amortization of historical intangibles |
|
|
|
|
|
|
||
Amortization of acquired intangibles |
|
|
( |
) |
|
|
( |
) |
Inventory fair value adjustments |
|
|
|
|
|
( |
) |
|
Interest income |
|
|
( |
) |
|
|
|
|
Interest expense |
|
|
|
|
|
|
||
Net loss - pro forma combined |
|
$ |
( |
) |
|
$ |
( |
) |
The unaudited pro forma financial information has been adjusted to reflect the amortization expense for acquired intangibles, removal of historical intangible asset amortization and recognition of expense associated with the step-up of inventory.
The pro forma data is presented for illustrative purposes only, and the historical results of NimbeLink are based on its books and records prior to the acquisition, and is not necessarily indicative of the consolidated results of operations of the combined business had the acquisition actually occurred at the beginning of fiscal year 2020. In addition, future results may vary significantly from the pro forma results reflected herein and should not be relied upon as an indication of the results of future operations of the combined business. The unaudited pro forma financial information does not reflect any operating efficiencies and cost savings that may be realized from the integration of the acquired entity. Revenue generated from acquired NimbeLink products for the year ended December 31, 2021 was the main driver of the increase in revenue from the Enterprise market, as disclosed in Note 18. Net income of $
Also see Note 8, Goodwill and Intangible Assets for further information on goodwill and intangible assets related to the NimbeLink acquisition.
Note 5. Cash and Cash Equivalents
The following tables show the Company’s cash and cash equivalents by significant investment category as of December 31 (in thousands):
|
|
December 31, 2021 |
|
|||||||||
|
|
Amortized |
|
|
Estimated fair value |
|
|
Cash and cash equivalents |
|
|||
Cash |
|
$ |
|
|
$ |
|
|
$ |
|
|||
Level 1: |
|
|
|
|
|
|
|
|
|
|||
Money market funds |
|
|
|
|
|
|
|
|
|
|||
Total |
|
$ |
|
|
$ |
|
|
$ |
|
|||
|
|
December 31, 2020 |
|
|||||||||
|
|
Amortized |
|
|
Estimated fair value |
|
|
Cash and cash equivalents |
|
|||
Cash |
|
$ |
|
|
$ |
|
|
$ |
|
|||
Level 1: |
|
|
|
|
|
|
|
|
|
|||
Money market funds |
|
|
|
|
|
|
|
|
|
|||
Total |
|
$ |
|
|
$ |
|
|
$ |
|
|||
F-18
Note 6. Inventories
Inventories are comprised of the following as of December 31 (in thousands):
|
|
December 31, |
|
|
December 31, |
|
||
|
|
2021 |
|
|
2020 |
|
||
Raw materials |
|
$ |
|
|
$ |
|
||
Finished goods |
|
|
|
|
|
|
||
Reserves |
|
|
( |
) |
|
|
( |
) |
Total Inventory |
|
$ |
|
|
$ |
|
||
As of December 31, 2021, $
Note 7. Property and Equipment
Depreciation and amortization of property and equipment is calculated on the straight-line method based on estimated useful lives of the assets. Leasehold improvements are depreciated over the shorter of their useful life or lease term.
|
|
December 31, |
|
|
December 31, |
|
||
|
|
2021 |
|
|
2020 |
|
||
Computers and software |
|
$ |
|
|
$ |
|
||
Furniture, fixtures, and equipment |
|
|
|
|
|
|
||
Manufacturing and testing equipment |
|
|
|
|
|
|
||
Construction in process |
|
|
|
|
|
|
||
Leasehold improvements |
|
|
|
|
|
|
||
Property and equipment, gross |
|
|
|
|
|
|
||
Less accumulated depreciation |
|
|
( |
) |
|
|
( |
) |
Property and equipment, net |
|
$ |
|
|
$ |
|
||
Depreciation expense was $
Note 8. Goodwill and Intangible Assets
The change in the carrying amount of goodwill was as follows (in thousands):
Goodwill as of December 31, 2020 |
|
$ |
|
|
Changes in goodwill |
|
|
|
|
Goodwill as of December 31, 2021 |
|
$ |
|
There were
F-19
The following is a summary of the Company’s acquired intangible assets as of December 31 (dollars in thousands):
|
|
December 31, 2021 |
|
|||||||||||
|
|
Weighted |
|
Gross |
|
|
Accumulated |
|
|
Net |
|
|||
|
|
|
|
|
|
|
|
|
|
|
|
|||
Market related intangibles |
|
|
$ |
|
|
$ |
|
|
$ |
|
||||
Customer relationships |
|
|
|
|
|
|
|
|
|
|
||||
Developed technologies |
|
|
|
|
|
|
|
|
|
|
||||
Covenants to non-compete |
|
|
|
|
|
|
|
|
|
|
||||
Total intangible assets, net |
|
|
|
$ |
|
|
$ |
|
|
$ |
|
|||
|
|
December 31, 2020 |
|
|||||||||||
|
|
Weighted |
|
Gross |
|
|
Accumulated |
|
|
Net |
|
|||
|
|
|
|
|
|
|
|
|
|
|
|
|||
Market related intangibles |
|
|
$ |
|
|
$ |
|
|
$ |
|
||||
Customer relationships |
|
|
|
|
|
|
|
|
|
|
||||
Developed technologies |
|
|
|
|
|
|
|
|
|
|
||||
Total intangible assets, net |
|
|
|
$ |
|
|
$ |
|
|
$ |
|
|||
The estimated annual amortization of intangible assets for the next five years and thereafter is shown in the following table (actual amortization expense to be reported in future periods could differ from these estimates as a result of acquisitions, divestitures, and asset impairments, among other factors) (in thousands):
|
|
Estimated future amortization |
|
|
2022 |
|
|
|
|
2023 |
|
|
|
|
2024 |
|
|
|
|
2025 |
|
|
|
|
2026 |
|
|
|
|
Thereafter |
|
|
|
|
Total |
|
$ |
|
|
Amortization expense was $
Note 9. Accrued Liabilities and Other
Accrued liabilities and other is comprised of the following as of December 31 (in thousands):
|
|
December 31, |
|
|
December 31, |
|
||
|
|
2021 |
|
|
2020 |
|
||
Accrued expenses |
|
$ |
|
|
$ |
|
||
VAT payable |
|
|
|
|
|
|
||
Accrued income taxes |
|
|
|
|
|
|
||
Contract liabilities |
|
|
|
|
|
|
||
Other current liabilities |
|
|
|
|
|
|
||
Accrued liabilities and other |
|
$ |
|
|
$ |
|
||
F-20
Note 10. Note Payable and Line of Credit
On January 7, 2021, as a result of the Nimbelink acquisition, the Company assumed a revolving line of credit (Line of Credit) with Choice Financial Group (Choice) whereby Choice had made available to the Company a secured credit facility of up to the lesser of (1) $
Note 11. Leases
Operating leases
The Company adopted ASC 842 on January 1, 2021, using the effective date transition method, which requires a cumulative-effect adjustment to the opening balance of retained earnings on the effective date. As a result of the adoption of ASC 842, the Company recognized right-of-use assets and lease liabilities of $
The Company has made certain assumptions and judgements when applying ASC 842 including the adoption of the package of practical expedients available for transition.
Operating lease arrangements primarily consist of office, warehouse and test house leases expiring at various years through . The facility leases have original lease terms of to
The Company has entered into various short-term operating leases primarily for test houses and office equipment, with an initial term of
Through the acquisition of NimbeLink, the Company assumed a lease, which was recorded as a right-of-use asset and lease liability of $
F-21
The table below presents aggregate future minimum payments due under leases, reconciled to lease liabilities included in the consolidated balance sheet as of December 31, 2021 (in thousands):
2022 |
|
$ |
|
|
2023 |
|
|
|
|
2024 |
|
|
|
|
2025 |
|
|
|
|
Total minimum payments |
|
|
|
|
Less imputed interest |
|
|
( |
) |
Less unrealized translation gain |
|
|
( |
) |
Total lease liabilities |
|
|
|
|
Less short-term lease liabilities |
|
|
( |
) |
Long-term lease liability |
|
$ |
|
Note 12. Treasury Stock
In September 2019, the Company’s Board of Directors (the Board) approved a share repurchase program (the 2019 Program) pursuant to which the Company could purchase up to $
During the year ended December 31, 2021, the Company repurchased an aggregate of
Note 13. Income Taxes
Income Taxes
The income tax provision (benefit) is as follows (in thousands):
|
|
For the Years Ended December 31, |
|
|||||
|
|
2021 |
|
|
2020 |
|
||
Current: |
|
|
|
|
|
|
||
U.S. federal |
|
$ |
|
|
$ |
|
||
State and local |
|
|
|
|
|
( |
) |
|
Foreign |
|
|
|
|
|
|
||
Total current provision |
|
|
|
|
|
|
||
Deferred: |
|
|
|
|
|
|
||
U.S. federal |
|
|
( |
) |
|
|
|
|
State and local |
|
|
( |
) |
|
|
( |
) |
Total deferred provision (benefit) |
|
|
( |
) |
|
|
|
|
Total tax provision |
|
$ |
( |
) |
|
$ |
|
|
F-22
Tax Rate Reconciliation
Reconciliations of the total income tax provision tax rate to the statutory federal income tax rate of
|
|
For the Years Ended December 31, |
|
|||||
|
|
2021 |
|
|
2020 |
|
||
Income taxes at statutory rates |
|
$ |
( |
) |
|
$ |
( |
) |
State income tax, net of federal benefit |
|
|
( |
) |
|
|
( |
) |
Permanent items |
|
|
|
|
|
( |
) |
|
Equity based compensation |
|
|
( |
) |
|
|
|
|
Change in fair value of contingent consideration |
|
|
|
|
|
|
||
Federal research credits |
|
|
( |
) |
|
|
( |
) |
Federal return to provision |
|
|
|
|
|
( |
) |
|
Foreign taxes |
|
|
|
|
|
|
||
Other |
|
|
|
|
|
|
||
Change in federal valuation allowance |
|
|
|
|
|
|
||
|
|
$ |
( |
) |
|
$ |
|
|
Significant Components of Current and Deferred Taxes
The tax effects of temporary differences that give rise to significant portions of the deferred tax assets and deferred tax liabilities at December 31, are as follows (in thousands):
|
|
December 31, |
|
|||||
|
|
2021 |
|
|
2020 |
|
||
Deferred tax assets: |
|
|
|
|
|
|
||
Net operating loss carryforwards |
|
$ |
|
|
$ |
|
||
Research and AMT credits |
|
|
|
|
|
|
||
Stock based compensation |
|
|
|
|
|
|
||
Lease liability |
|
|
|
|
|
|
||
Accrued and other |
|
|
|
|
|
|
||
|
|
|
|
|
|
|
||
Less valuation allowance |
|
|
( |
) |
|
|
( |
) |
Deferred tax assets, net of allowance |
|
|
|
|
|
|
||
Deferred tax liabilities: |
|
|
|
|
|
|
||
Fixed assets |
|
|
( |
) |
|
|
( |
) |
Goodwill |
|
|
( |
) |
|
|
( |
) |
Right-of-use asset |
|
|
( |
) |
|
|
— |
|
Intangible asset |
|
|
( |
) |
|
|
|
|
Deferred tax liabilities |
|
|
( |
) |
|
|
( |
) |
Total deferred tax liabilities |
|
$ |
( |
) |
|
$ |
( |
) |
The Company has established a valuation allowance against its net deferred tax assets due to the uncertainty surrounding the realization of such assets. The Company periodically evaluates the recoverability of the deferred tax assets. At such time it is determined that it is more likely than not that deferred assets are realizable, the valuation allowance will be reduced. The Company has recorded a valuation allowance of $
At December 31, 2021 the Company had federal and state tax loss carryforwards of approximately $
F-23
indefinitely and be available to offset up to
At December 31, 2021 the Company had federal and state tax credit carryforwards of approximately $
The Internal Revenue Code (IRC) Sections 382 and 383 limit annual use of NOL and research and development credit. In 2021, the Company completed an ownership change analysis pursuant to IRC Section 382 through taxable year ended December 31, 2020, in which the Company determined that the Company had undergone an ownership change on June 30, 2017. While the Company's NOLs and tax credit carryforwards generated prior to June 30, 2017 are subject to an annual limitation pursuant to Sections 382 and 383 of the Code, the NOLs are fully available by December 31, 2020 and the Company does not anticipate a go forward limitation on the Company's NOL carryforwards. The Company's use of federal and state NOLs and tax credit carryforwards could be limited further by ownership changes that occur, or may have occurred, after December 31, 2020. In addition, the ownership change analysis completed through December 31, 2020 did not include a historical change ownership analysis for NimbeLink prior to its acquisition by the Company. Ownership changes occurring for NimbeLink, prior to acquisition by the Company, could subject approximately $
The following table summarizes the reconciliation of the unrecognized tax benefits activity during the years ended December 31 (in thousands):
|
|
2021 |
|
|
2020 |
|
||
Beginning unrecognized tax benefits |
|
$ |
|
|
$ |
|
||
Gross increases - tax positions in prior period |
|
|
|
|
|
|
||
Gross increases - current year tax positions |
|
|
|
|
|
|
||
Purchase accounting |
|
|
|
|
|
— |
|
|
Ending unrecognized tax benefits |
|
$ |
|
|
$ |
|
||
The unrecognized tax benefit amounts are reflected in the determination of the Company’s deferred tax assets. If recognized, $
The Company’s policy is to recognize interest and/or penalties related to income tax matters in income tax expense. The Company has an accrual for interest or penalties of $
Due to the existence of federal and state net operating loss and credit carryovers, the Company’s tax years that remain open and subject to examination by tax jurisdiction are years 2000 and forward for federal and years 2006 and forward for the state of California.
Note 14. Stockholders’ Equity
In August 2016, the Company's Board adopted the 2016 Equity Inventive Plan (the 2016 Plan) for employees, directors and consultants. In February 2021, the Board adopted the 2021 Employment Inducement Incentive Award Plan (Inducement Plan), which provides for grants of equity-based awards.
F-24
The following common stock is reserved for future issuance at December 31(1) (in thousands):
|
|
December 31, |
|
|
December 31, |
|
||
|
|
2021 |
|
|
2020 |
|
||
Warrants issued and outstanding |
|
|
|
|
|
|
||
Stock option awards issued and outstanding |
|
|
|
|
|
|
||
Authorized for grants under the 2016 Equity Incentive Plan(2) |
|
|
|
|
|
|
||
Authorized for grants under the Inducement Plan(3) |
|
|
|
|
|
|
||
Authorized for grants under the 2016 Employee Stock Purchase Plan(4) |
|
|
|
|
|
|
||
|
|
|
|
|
|
|
||
Note 15. Stock Based Compensation
Stock Options
In August 2016, the Company’s board of directors adopted the 2016 Equity Incentive Plan (the 2016 Plan) for employees, directors, and consultants. As of December 31, 2021,
The vesting period for stock options granted to employees is generally to
Commencing in 2019, each non-employee member of the board of directors will receive an annual award on the first trading day in February a number of stock options having a value of $
The grant-date fair value of each option award is estimated on the date of grant using the Black-Scholes-Merton option-pricing model. The weighted average assumptions for grants during the years ended December 31, 2021 and 2020, are provided in the following table:
|
|
December 31, |
|
|
December 31, |
|
||
|
|
2021 |
|
|
2020 |
|
||
Expected dividend yield |
|
|
% |
|
|
% |
||
Expected volatility |
|
|
% |
|
|
% |
||
Expected term (years) |
|
|
|
|
|
|
||
Risk-free interest rate |
|
|
% |
|
|
% |
||
F-25
A summary of the Company’s stock option activity is as follows (shares in thousands):
|
|
|
|
|
Weighted average |
|
||||||
|
|
Number of |
|
|
Exercise |
|
|
Remaining |
|
|||
Balance at December 31, 2020 |
|
|
|
|
$ |
|
|
|
|
|||
Granted |
|
|
|
|
|
|
|
|
|
|||
Exercised |
|
|
( |
) |
|
|
|
|
|
|
||
Expired/Forfeited |
|
|
( |
) |
|
|
|
|
|
|
||
Balance at December 31, 2021 |
|
|
|
|
|
|
|
|
|
|||
|
|
|
|
|
|
|
|
|
|
|||
Vested and exercisable at December 31, 2021 |
|
|
|
|
|
|
|
|
|
|||
Vested and expected to vest at December 31, 2021 |
|
|
|
|
|
|
|
|
|
|||
During the year ended December 31, 2021, the Company received proceeds of $
The weighted average grant-date fair values of options granted during the years ended December 31, 2021 and 2020, were $
At December 31, 2021 and 2020, there was $
Restricted Stock Units
The following table summarizes the Company’s restricted stock unit activity (shares in thousands):
|
|
Restricted |
|
|
Weighted |
|
||
Balance at December 31, 2020 |
|
|
|
|
$ |
|
||
Grants |
|
|
|
|
|
|
||
Vested and released |
|
|
( |
) |
|
|
|
|
Forfeited |
|
|
( |
) |
|
|
|
|
Balance at December 31, 2021 |
|
|
|
|
|
|
||
Commencing in 2019, each non-employee member of the board of directors receives, on the first trading day in February of each year, such number of restricted stock units as is determined by dividing (a) $
F-26
During the year ended December 31, 2021,
As of December 31, 2021, there was $
The Company currently uses authorized and unissued shares to satisfy share award exercises.
Employee Stock Purchase Plan (ESPP)
The Company maintains the Employee Stock Purchase Plan (ESPP) that provides employees an opportunity to purchase common stock through payroll deductions. The ESPP is implemented through consecutive
Based on the
During the year ended December 31, 2021, the Company received proceeds of $
Stock-based compensation expense
The stock-based compensation is reflected in the statements of operations as follows (in thousands):
|
|
For the Years Ended December 31, |
|
|||||
|
|
2021 |
|
|
2020 |
|
||
Cost of goods sold |
|
$ |
|
|
$ |
|
||
Research and development |
|
|
|
|
|
|
||
Sales and marketing |
|
|
|
|
|
|
||
General and administrative |
|
|
|
|
|
|
||
Total stock-based compensation expense |
|
$ |
|
|
$ |
|
||
Note 16.
Indemnification
In some agreements to which the Company is a party, the Company has agreed to indemnify the other party for certain matters, including, but not limited to, product liability and intellectual property. To date, there have been no known events or circumstances that have resulted in any material costs related to these indemnification provisions and no liabilities have been recorded in the accompanying financial statements.
F-27
Supply Agreement
In September 2020, the Company entered into a supply agreement with a vendor to purchase up to $
Employment Agreements
On February 18, 2021, the Company entered into an amended and restated employment agreement with Morad Sbahi in connection with his promotion to Senior Vice President, Global Product and Marketing. The amended and restated employment agreement provides for an indefinite term and for at-will employment. Pursuant to the employment agreement, in the event the Company terminates Mr. Sbahi's employment without cause or he resigns for good reason, he is entitled to a lump sum cash payment in an amount equal to twelve months of his base salary plus his target bonus (prorated for the portion of the calendar year during which such termination occurs) and continuation of health benefits at the Company's expense for a period of twelve months following the date of termination.
On April 19, 2021, the Company entered into an employment agreement with Dr. Ali Sadri, the Company’s Senior Vice President, Engineering. The employment agreement provides for an indefinite term and for at-will employment. Pursuant to the employment agreement, in the event the Company terminates Mr. Sadri's employment without cause or he resigns for good reason, he is entitled to a lump sum cash payment in an amount equal to twelve months of his base salary plus his target bonus (prorated for the portion of the calendar year during which such termination occurs) and continuation of health benefits at the Company's expense for a period of twelve months following the date of termination.
Note 17. Customer and Geographic Information
Concentration of Sales and Accounts Receivable
The following represents customers that accounted for
|
|
For the Years Ended December 31, |
|
|||||
|
|
2021 |
|
|
2020 |
|
||
Customer A |
|
|
% |
|
|
% |
||
Customer B |
|
|
% |
|
|
% |
||
Customer C |
|
|
% |
|
|
% |
||
The following represents customers that accounted for
|
|
As of December, 31 |
|
|||||
|
|
2021 |
|
|
2020 |
|
||
Customer A |
|
|
% |
|
|
% |
||
Customer B |
|
|
% |
|
|
% |
||
Customer C |
|
|
% |
|
|
% |
||
Customer D |
|
|
% |
|
|
% |
||
Concentration of Purchases
During the year ended December 31, 2021, the Company’s products were primarily manufactured by three contract manufacturers with locations in China, one in Vietnam, one in Minnesota and by the Company’s Arizona facility.
F-28
Concentration of Property and Equipment
The Company’s property and equipment, net by geographic region are as follows:
|
|
As of December, 31 |
|
|||||
|
|
2021 |
|
|
2020 |
|
||
North America |
|
$ |
|
|
$ |
|
||
Asia Pacific (APAC) |
|
|
|
|
|
|
||
Europe, Middle East and Africa (EMEA) |
|
|
|
|
|
|
||
Property and equipment, net |
|
$ |
|
|
$ |
|
||
Note 18. Disaggregated Revenues
Disaggregated revenues for the years ended December 31 are as follows (in thousands):
|
|
For the Years Ended December 31, |
|
|||||
|
|
2021 |
|
|
2020 |
|
||
By Sales Channel: |
|
|
|
|
|
|
||
Distributors and resellers |
|
$ |
|
|
$ |
|
||
OEM/ODM/Contract manufacturer |
|
|
|
|
|
|
||
Other |
|
|
|
|
|
|
||
Total sales |
|
$ |
|
|
$ |
|
||
|
|
|
|
|
|
|
||
By Market Group: |
|
|
|
|
|
|
||
Consumer |
|
$ |
|
|
$ |
|
||
Enterprise |
|
|
|
|
|
|
||
Automotive |
|
|
|
|
|
|
||
Total sales |
|
$ |
|
|
$ |
|
||
|
|
|
|
|
|
|
||
By Geography: |
|
|
|
|
|
|
||
China (including Hong Kong and Taiwan) |
|
$ |
|
|
$ |
|
||
North America |
|
|
|
|
|
|
||
Rest of the world |
|
|
|
|
|
|
||
Total sales |
|
$ |
|
|
$ |
|
||
Enterprise revenue for year ended December 31, 2021, is primarily comprised of revenue generated from the sale of industrial Internet of Things products that were acquired through the NimbeLink acquisition. Revenue generated from the United States was $
Note 19. Employee Benefit Plan
The Company’s 401(k) plan covers all of the U.S. employees beginning the first of the month following the first 90 days of their employment. Under this plan, employees may elect to contribute up to
F-29
Note 20. Subsequent Events
CFO transition
On February 8, 2022, the Company announced the resignation of its Chief Financial Officer and Secretary effective at the end of the day on March 1, 2022.
Revolving Line of Credit
On February 18, 2022 (the “Effective Date”), the Company and its subsidiary, NimbeLink Corp (together the “Borrowers”), entered into a loan and security agreement (the Loan Agreement) with Silicon Valley Bank (SVB), pursuant to which the Borrowers have a revolving line of credit (the Revolving Line of Credit) for $
Arizona facility shut down
In February 2022, the Company determined to move of its in-house manufacturing operations to external contract manufacturers. As a result, the Company will shut down its Arizona manufacturing operations where aftermarket fleet and AirgainConnect products are produced. The shut down of the operations in Arizona is expected to be completed in the second quarter of 2022. The Company estimates that it will incur total aggregate charges of approximately $20,000, mostly related to severance and related costs. The Company does not expect to incur lease exit costs as the lease terminates in . The Company expects that most of these charges will be cash expenditures and expects to recognize most of these charges in the first quarter of 2022.
Potential product warranty claims
In January 2022, the Company was notified of a potential product warranty claim. The Company is currently in the early stages of evaluating the claim and has not yet identified the root cause of the issue. A loss is reasonably possible, however, the Company cannot reasonably estimate the impact of the potential loss at the date of filing.
F-30
EXHIBIT INDEX
|
|
Exhibit |
Description of Exhibit |
|
|
3.1(1) |
|
|
|
3.2(2) |
|
|
|
4.1(3) |
Specimen stock certificate evidencing the shares of common stock |
|
|
4.2(3) |
|
|
|
4.3 |
|
|
|
10.1(5) |
Office Lease, dated June 13, 2013, by and between Kilroy Realty, L.P. and the Registrant |
|
|
10.2(3) |
|
|
|
10.3#(5) |
|
|
|
10.4#(5) |
Form of Stock Option Agreement under the Airgain, Inc. 2003 Equity Incentive Plan |
|
|
10.5#(5) |
|
|
|
10.6#(5) |
|
|
|
10.7#(3) |
|
|
|
10.8#(4) |
Form of Stock Option Agreement under the Airgain, Inc. 2016 Incentive Award Plan |
|
|
10.9#(6) |
Form of Restricted Stock Unit Agreement under the Airgain, Inc. 2016 Incentive Award Plan |
|
|
10.10#(3) |
|
|
|
10.11# |
|
|
|
10.12(7) |
(13) Incorporated by reference to the Registrant's Quarterly Report on Form 10-Q filed with the SEC on May 6,
2021.
(14) Incorporated by reference to the Registrant's Current Report on Form 8-K filed with the SEC on February 23,
2022.
# Indicates management contract or compensatory plan.
* These certifications are being furnished solely to accompany this annual report pursuant to 18 U.S.C. Section 1350, and are not being filed for purposes of Section 18 of the Securities Exchange Act of 1934 and are not to be incorporated by reference into any filing of the Registrant, whether made before or after the date hereof, regardless of any general incorporation language in such filing.
Certain schedules referenced in the Stock Purchase Agreement have been omitted in accordance with Item 601(b)(2) of Regulation S-K. A copy of any omitted schedule and/or exhibit will be furnished supplementally to the Securities and Exchange Commission upon request. Portions of this exhibit (indicated by asterisks) have been omitted pursuant to Regulation S-K, Item 601(b)(10). Such omitted information is not material and would likely cause competitive harm to the Registrant if publicly disclosed.
SIGNATURES
Pursuant to the requirements of Section 13 or 15(d) of the Securities Exchange Act of 1934, the registrant has duly caused this annual report to be signed on its behalf by the undersigned, thereunto duly authorized.
AIRGAIN, INC. |
|
/s/ Jacob Suen |
|
Jacob Suen Chief Executive Officer |
Date: March 21, 2022
Pursuant to the requirements of the Securities Exchange Act of 1934, this annual report has been signed below by the following persons on behalf of the registrant and in the capacities and on the dates indicated.
|
Signature
|
Title
|
Date
|
|
|
|
|
/s/ Jacob Suen
Jacob Suen |
Chief Executive Officer, President and Director (Principal Executive Officer) |
March 21, 2022 |
|
|
|
|
/s/ David B. Lyle
David B. Lyle |
Principal Financial and Accounting Officer |
March 21, 2022 |
|
|
|
|
/s/ James K. Sims
James K. Sims |
Chairman |
March 21, 2022 |
|
|
|
|
/s/ Kiva A. Allgood
Kiva A. Allgood |
Director |
March 21, 2022 |
|
|
|
|
/s/ Tzau-Jin Chung
Tzau-Jin Chung |
Director |
March 21, 2022 |
|
|
|
|
/s/ Joan H. Gillman
Joan H. Gillman |
Director |
March 21, 2022 |
|
|
|
|
/s/ Thomas A. Munro
Thomas A. Munro |
Director |
March 21, 2022 |
|
|
|
|
/s/ Arthur M. Toscanini
Arthur M. Toscanini |
Director |
March 21, 2022 |